- Dynatrace Community
- Dynatrace
- Learn
- Troubleshooting
- How to generate a HAR file and enable dtHealthCheck.
- Subscribe to RSS Feed
- Mark as New
- Mark as Read
- Printer Friendly Page
- Mark as New
- Subscribe to RSS Feed
- Permalink
on
26 Sep 2023
02:17 PM
- edited on
19 Apr 2024
01:53 PM
by
![]() Edo-Akse
Edo-Akse
What is and How to generate a HAR File?
A HAR (HTTP Archive) file is a log of all network requests made by a web page in your web browser. It includes details about each request, such as the URL, response headers, request headers, and timings. Generating a HAR file is a useful troubleshooting tool because it provides a comprehensive snapshot of a web page's network activity, allowing for precise issue identification.
How to generate a HAR file:
This tutorial covers Google Chrome, Microsoft Edge, and Mozilla Firefox. (For webview, see this tutorial.)
Step 1: Open the Developer Tools.
- Open the Browser.
- Press F12 on your keyboard to open Developer Tools.
- Alternatively, right-click anywhere on the page and select "Inspect" or "Inspect Element."
- For Chrome, you can also use the three-dot menu in the top-right corner of the browser > More tools > Developer tools.
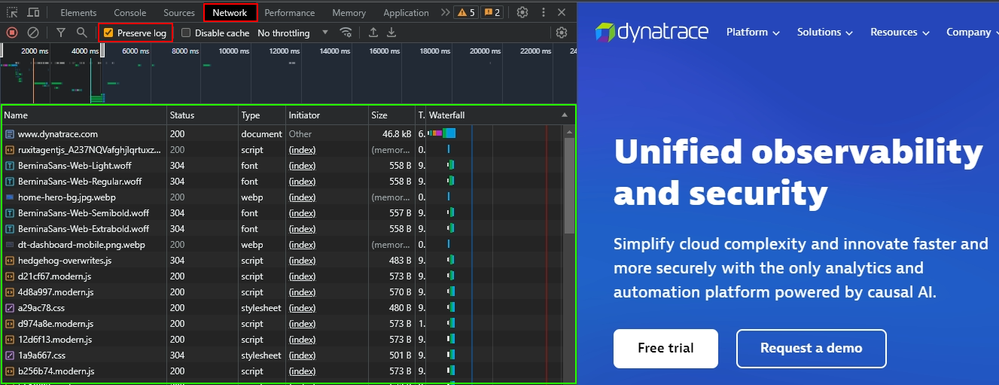
Step 2: Go to the "Network" Tab and check the Preserve log checkbox.
- In the Developer Tools, you should see a set of tabs at the top. Click on the "Network" tab.
- Make sure the "Preserve log" checkbox is checked. This option keeps the network log intact even after a page refresh or navigation.
- Optionally, you can clear the network log by clicking the "Clear" button. ∅
Chrome and Edge:
Firefox:
Step 3: Reload the Page or Trigger the Actions.
- To capture all network activity on the webpage, you'll need to reload the page or perform the specific actions that trigger the network requests you're interested in (e.g., submitting a form, clicking a link, etc.).
Step 4: Stop Recording.
- Once you've captured the network activity you need, return to the "Network" tab in Developer Tools. You should see a list of network requests made by the webpage.
- Click the red "Stop" button (square icon) in the top-left corner of the "Network" tab to stop recording network activity.
- Chrome and Edge:
- Firefox: | |
Step 5: Export the HAR File.
- Right-click anywhere in the list of network requests.
- Select "Save as HAR with content" (Chrome and Edge).
- "Save All As HAR" (Firefox).
- Choose a location on your computer to save the HAR file, give it a descriptive name, and click "Save."
How to enable dtHealthCheck.
dtHealthCheck is a feature enabled by adding the User-Agent header value dtHealthCheck. Responses to any requests made with this header contain additional headers and sometimes an HTML marker in the body. If injection problems occur, these headers provide diagnostic details, which may help us to identify the issue. (It only works for Google Chrome and Microsoft Edge).
Step 1: Open Chrome or Edge Developer Tools.
- Open the Browser.
- Press F12 on your keyboard to open Developer Tools.
- Alternatively, right-click anywhere on the page and select "Inspect" or "Inspect Element."
- For Chrome, you can also use the three-dot menu in the top-right corner of the browser > More tools > Developer tools.
Step 2: Access Network Conditions.
- There are two ways of opening Network Conditions.
1 - In the Developer Tools, you should see a set of tabs at the top. Click on the "Network" tab. In the additional settings bar, click the "More network conditions..." icon (the one with a yellow square), and the Network conditions will open.
2 - In the Developer Tools pane, locate and click the three vertical dots (Options) in the top-right corner of the pane. Choose "Network conditions" from the dropdown menu.
Step 3: Untick "Use browser default" and Customize User-Agent to "dtHealthCheck".
- In the "Network conditions" settings, you'll find an option called "User agent." Untick the box that says "Use browser default" to enable manual User-Agent configuration.
- After unticking "Use browser default," a dropdown menu will appear. Select "Custom..."
- A text field will appear where you can enter a custom User-Agent string. Enter "dtHealthCheck" into this field.
Step 4: Open the webpage.
- As soon as you set the User-Agent to "dtHealthCheck" in the "Network Conditions" settings, it should take effect for the currently open tab, and you can proceed to open or reload the webpage and create the session. (Don't close the tab or browser. Once it's closed, the option will reset to default).
Step 5: Export the HAR File.
- Right-click anywhere in the list of network requests.
- Select "Save as HAR with content" (Chrome and Edge).
- Choose a location on your computer to save the HAR file, give it a descriptive name, and click "Save."
Note: The dtHealthCheck will only show results if the OneAgent is working on the web server. Keep in mind that it doesn't work for Agentless injection.


