- Dynatrace Community
- Ask
- Alerting
- Re: Adding hostname in the metric event description
- Subscribe to RSS Feed
- Mark Topic as New
- Mark Topic as Read
- Pin this Topic for Current User
- Printer Friendly Page
Adding hostname in the metric event description
- Mark as New
- Subscribe to RSS Feed
- Permalink
27 Mar 2024 08:23 AM
Hi,
I'm trying to monitor CPU usage of a specific process group using metric event (Query definition type as metric key). What can be done to avail host name in the event template description? At present, problem generated shows "Process group" and "severity" but expecting affected host to be part of this description.
Looking for thoughts since I presume it's not a straightforward one!
Rgds.
- Labels:
-
anomaly detection
- Mark as New
- Subscribe to RSS Feed
- Permalink
27 Mar 2024 09:08 AM
Please try using this metric selector:
builtin:tech.generic.cpu.usage:filter(in("dt.entity.process_group_instance", entitySelector("type(~"PROCESS_GROUP_INSTANCE~"),entityName.equals(~"YOUR PROCESS~")"))):splitBy("dt.entity.process_group_instance"):parents
- Mark as New
- Subscribe to RSS Feed
- Permalink
27 Mar 2024 09:18 AM
Thanks @PacoPorro. If I understand correctly, we can't have "hostname" in the event template description if I intend to use metric key rather than metric selector?
- Mark as New
- Subscribe to RSS Feed
- Permalink
27 Mar 2024 09:31 AM
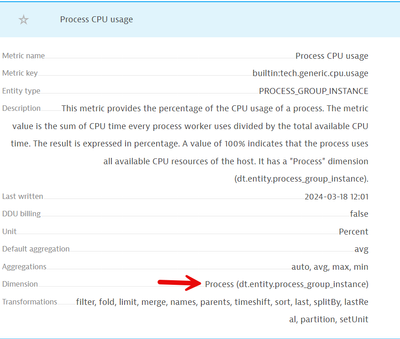
As you can see in the metric explorer the only available dimension is the process group instance, so you want be able to get it directly.
You can also create a tag "host" with the host detected name, and add the "tags placeholder" to the event.
- Mark as New
- Subscribe to RSS Feed
- Permalink
27 Mar 2024 09:36 AM
I'm using below one now,
builtin:tech.generic.cpu.usage:filter(and(or(in("dt.entity.process_group_instance",entitySelector("type(process_group_instance),fromRelationship.isInstanceOf(type(PROCESS_GROUP),tag(~"XXXXXX~"))"))),or(in("dt.entity.process_group_instance",entitySelector("type(process_group_instance),fromRelationship.isProcessOf(type(HOST),osType(~"LINUX~"))"))))):splitBy("dt.entity.process_group_instance"):parents
Like you said it does give hostname, process group and cpu usage in %. Only thing I worry is, dimension limits. We have a large server set ~10K Linux hosts.
- Mark as New
- Subscribe to RSS Feed
- Permalink
27 Mar 2024 09:41 AM
This time with usage of above metric explorer, I can get options to populate hostname in the event template description, but as expected trouble is with dimension limits.
Featured Posts


