- Dynatrace Community
- Ask
- Alerting
- Re: CPU and Memory alerts
- Subscribe to RSS Feed
- Mark Topic as New
- Mark Topic as Read
- Pin this Topic for Current User
- Printer Friendly Page
- Mark as New
- Subscribe to RSS Feed
- Permalink
26 Nov 2021 01:40 PM
Hello,
I understand there are two ways we can set alerts in Dynatrace - Static and Auto-baselining (AI solution).
My question is - does the latter work for infrastructure alerts like CPU and Memory ?
Today we have custom static alerts set at 70% CPU and memory consumption but I feel it's not very effective. Our infrastructure is in AWS (EC2 and ECS Fargate). What would be the most optimal way of setting infra alerts, so as to reduce alert storms and False positives ?
Thank you,
Solved! Go to Solution.
- Labels:
-
problems classic
- Mark as New
- Subscribe to RSS Feed
- Permalink
26 Nov 2021 03:23 PM - edited 26 Nov 2021 03:24 PM
The auto-baselining for infrastructure alerts works very well in my opinion. Almost no false positives, and when they occur it's because the high CPU was temporary. And almost no false negatives, which I've only seen when CPU spikes take some seconds, which is expected, as to essentially reduce alert spamming.
I too tried some static definitions in the past, believing I could do better than Davis. I was proved wrong several times, so now I stick with auto-baselining...
- Mark as New
- Subscribe to RSS Feed
- Permalink
26 Nov 2021 04:15 PM
This is something that I still unsure about in Dynatrace with Host monitoring... is there a baseline for it?
As far I know it is always static thresholds, but you can choose left them as "automatically" or manually.
When we leave it as automatically, does Dynatrace create a baseline for it the same way it does for transactions response time, for example? I guess no.
Am I wrong? 🤔
- Mark as New
- Subscribe to RSS Feed
- Permalink
26 Nov 2021 08:58 PM
CPU is much more volatile than response times. So the way Dynatrace calculates it is based on the thresholhs that you point to, and that you can change:
- Mark as New
- Subscribe to RSS Feed
- Permalink
29 Nov 2021 08:34 AM
Hi Antonio,
This is the static approach, am I right? With a sliding window.
Where can we define sliding window size?
- Mark as New
- Subscribe to RSS Feed
- Permalink
30 Nov 2021 01:40 PM
Sliding window size is 3 out of 5 samples (where samples refers to 1 minute samples with 6 measurements each minute). You can't modify the ootb mechanisms sliding window size, but you can use your own sliding window size in 'custom events for alerting'.
Best greetings,
Wolfgang
- Mark as New
- Subscribe to RSS Feed
- Permalink
30 Nov 2021 01:33 PM
The General rule of thumb to determine if the Dynatrace AI (DAVIS) applies to your entity that you are monitoring comes down to weather or not the Oneagent is installed and touches that entity. For things such as host CPU, Memory, Disk and network, they all fall under AI (DAVIS) because the host has the oneagent installed on them.
For things that don't have a Oneagent and are pulled via API Calls, like K8 Cluster Metrics, Azure Subscription data like Azure Firewall, Service bus etc... they are all pulled via API so there is no Oneagent to leverage the AI (DAVIS). You can however use a work around for these types of things such as Custom Events for Alerting and set the thresholds as adaptive.
- Mark as New
- Subscribe to RSS Feed
- Permalink
30 Nov 2021 02:06 PM
Still not clear to me... does Infrastructure alerts use baselines too?
If I do have an host that keeps the MEM utilization always on 97% (due to some application requirement), will Dynatrace understand that this is "normal" and do not alert?
Or, let's say I have a Disk utilization always on 5%, then suddenly it raises to 85% (still below the default static threshold), will Dynatrace understand that this is a problem (due to spike)?
- Mark as New
- Subscribe to RSS Feed
- Permalink
30 Nov 2021 02:44 PM - edited 30 Nov 2021 03:31 PM
If your Metrics are set to "Automatic" then AI baselining will be used. If you have it set to custom and set the values static, then those values will be used and not AI Detection.
Static is static, If it breaches it, it alerts - no ifs ands or buts
AI uses baselines, If it spikes up dynatrace looks at the baseline and asks itself, is this deviated from the Norm? If yes, then alarm, if not, dont alert. If this Spike happens every Tuesday Night at 9PM, that will be added into the baseline. That spike might be normal as jobs are running in off hours, but if a static threshold was set it would alert every time.
Think of it as a Speed Camera. Speed Cameras would be Static. Speed Above X, ticket sent. Where a Police Man would be the AI, and can decide for himself; 1-2 over the speed limit is fine, but 10 over is a ticket.
- Mark as New
- Subscribe to RSS Feed
- Permalink
17 Apr 2024 03:37 PM
Hi Chad - How do we create our own metric event for CPU saturation if the CPU goes beyond 85% and create a slowdown event. could you please provide steps
- Mark as New
- Subscribe to RSS Feed
- Permalink
03 Dec 2021 05:49 PM
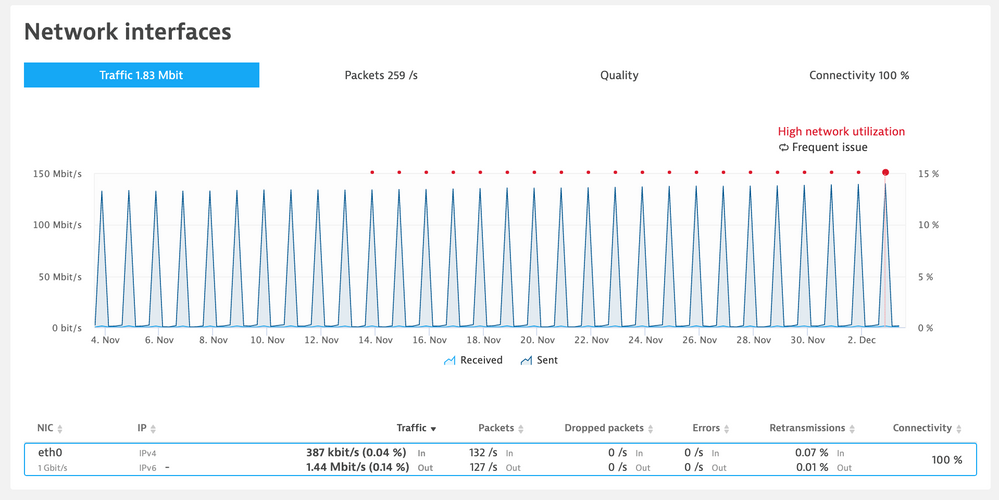
One real example here to illustrate why I believe there is no baseline involved on infrastructure anomaly detection:
Everyday we are having Problems generated for high network utilization due to the DB2 backups
If the baseline really exists, why Davis does not understand the network behavior and just "ignore" the peaks?
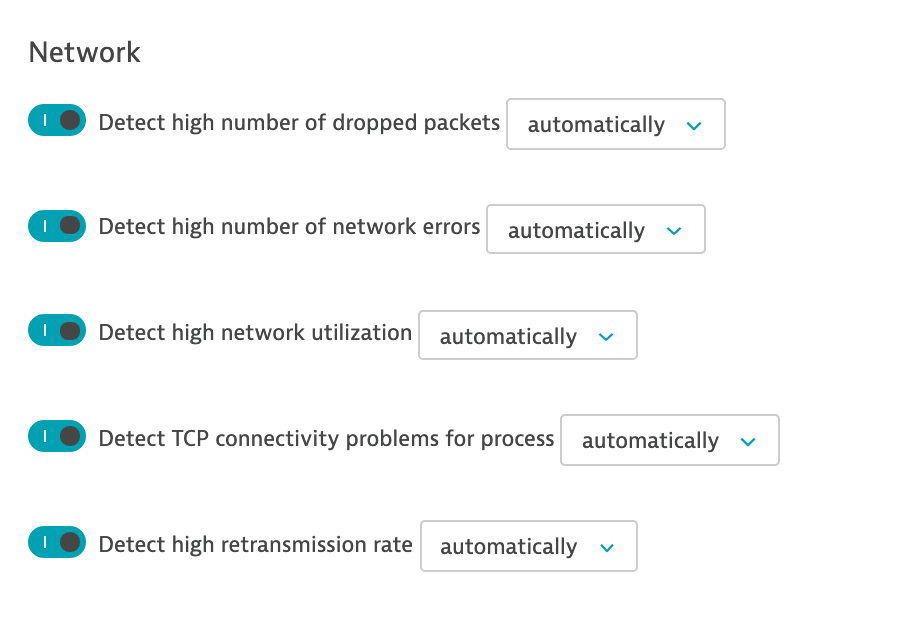
The network anomaly detection are set to Automatic:
- Mark as New
- Subscribe to RSS Feed
- Permalink
20 Apr 2022 09:00 PM
Have people been using Custom Alerts for CPU, Memory, Disk with success using "Auto-adaptive baseline"? We are trying out in lower environment and curious what other peoples results are. Thanks for input.
- Mark as New
- Subscribe to RSS Feed
- Permalink
05 May 2022 07:21 PM
We tested in our lower environment and seems like auto adaptive does NOT work well for CPU, Memory and Disk.
Featured Posts


