- Dynatrace Community
- Ask
- Alerting
- Re: Log monitoring for active gate synthetic log
- Subscribe to RSS Feed
- Mark Topic as New
- Mark Topic as Read
- Pin this Topic for Current User
- Printer Friendly Page
- Mark as New
- Subscribe to RSS Feed
- Permalink
12 Mar 2020
12:38 PM
- last edited on
18 Oct 2024
09:30 AM
by
![]() MaciejNeumann
MaciejNeumann
- Mark as New
- Subscribe to RSS Feed
- Permalink
12 Mar 2020 03:58 PM
Can you be more specific about what you are trying to accomplish exactly? My initial response based on my interpretation of your question would be to suggest deploying a OneAgent on the Environment ActiveGate you have configured for Internal Synthetics.
- Mark as New
- Subscribe to RSS Feed
- Permalink
12 Mar 2020 06:09 PM
Hi Dave,
We have a requirement where customer expecting some more details under problem notification in case of failure of HTTP monitor.
HTTP monitor has post execution script with some conditions. The fail condition added in if else should populate under problem notification. More details are posted in question. Please find the link here.
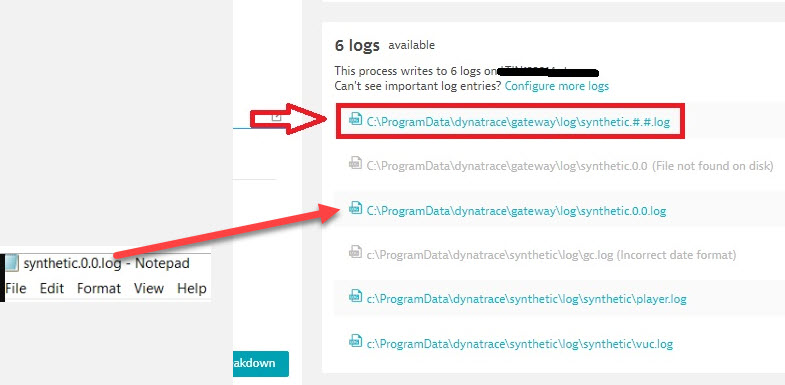
I have installed oneagent on the active gate machine and configured synthetic log file via "Configure more logs" section. Now I wanted to know, how we can use these logs to get alerts/problem notification along with desired content?
Thanks...
- Mark as New
- Subscribe to RSS Feed
- Permalink
12 Mar 2020 07:20 PM
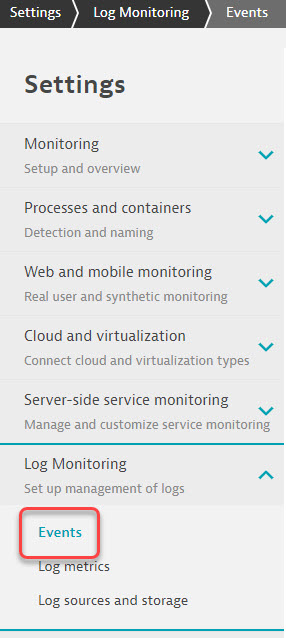
You can do this by going to the settings>Log Monitoring>Events. From there you can configure the rules for events and you can set them to initiate alerts within the UI just like you have seen for anomalies on servers.

- Mark as New
- Subscribe to RSS Feed
- Permalink
13 Mar 2020 07:41 AM
Hi Clad,
Defined one event like below but nothing is showing up in Pattern Occurrence graph.
Any clue why it is happening.

Thanks...
- Mark as New
- Subscribe to RSS Feed
- Permalink
13 Mar 2020 12:04 PM
- Mark as New
- Subscribe to RSS Feed
- Permalink
13 Mar 2020 12:55 PM
No..that is the dilemma now..I have made HTTP monitor fail forcefully. But still No event appearing on graph.
- Mark as New
- Subscribe to RSS Feed
- Permalink
13 Mar 2020 01:01 PM
can you verify in the Activegate log you are monitoring that the string is present with that forced fail, and that the string matches what you put into the log detection rule?
- Mark as New
- Subscribe to RSS Feed
- Permalink
13 Mar 2020 01:08 PM
Yes I checked it..String is absolutely present in the logs.Please see the attached sreenshot.
- Mark as New
- Subscribe to RSS Feed
- Permalink
13 Mar 2020 01:36 PM
thats good. .and that log file is showing up in Dynatrace on the respected host via the oneagent correct?
- Mark as New
- Subscribe to RSS Feed
- Permalink
13 Mar 2020 01:43 PM
I would also recommend matching the Syntax, just to be sure that its not case sensitive.

- Mark as New
- Subscribe to RSS Feed
- Permalink
13 Mar 2020 01:47 PM
Yes. Log file is showing up. Please check the attached screenshot.
In fact, in current setting it (down word) is in uppercase only still no desired result.
- Mark as New
- Subscribe to RSS Feed
- Permalink
13 Mar 2020 01:55 PM
can you set it to the other log file just to see if it captures anything as the log file you send is "Synthetic.0.0.log"

- Mark as New
- Subscribe to RSS Feed
- Permalink
13 Mar 2020 02:17 PM
Good News. It's started working. But problem notification don't have desired information like "Service1 is DOWN". 😞

Attaching a screenshot of problem notification.
Thanks...
- Mark as New
- Subscribe to RSS Feed
- Permalink
13 Mar 2020 02:32 PM
well that's progress! I would tinker around with the settings as it relates to how the log events are raised and see if you can manipulate it the way you want it. otherwise we might need to put in a Request for Feature to allow you to customize the alert data inside the problem card.
If you integrate the Dynatrace Mobile app, you will be able to click into the alert and see what data is inside it as well as leave comments on it.
Also maybe if you rename the log event to s naming convention like "Application_Message" so I would stick with a naming convention that would display "EasyTravel Service 1 Down" and that would show up on the problem card.

- Mark as New
- Subscribe to RSS Feed
- Permalink
17 Mar 2020 08:56 AM
Hey @Akshay S. - unfortunately right now you can not pass text pattern used in event creation to problem notification. For metrics based on log text occurrence it's also not possible.
Featured Posts
