- Dynatrace Community
- Ask
- Alerting
- serviceMethodGroup x serviceMethod - Problem Json fields
- Subscribe to RSS Feed
- Mark Topic as New
- Mark Topic as Read
- Pin this Topic for Current User
- Printer Friendly Page
- Mark as New
- Subscribe to RSS Feed
- Permalink
15 Aug 2022
04:18 PM
- last edited on
16 Aug 2022
10:28 AM
by
![]() MaciejNeumann
MaciejNeumann
We have faced two kinds of situations which I cannot understand why they are different.
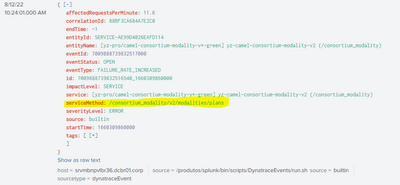
The first one is when our Problems Json comes with the serviceMethod field defined, as the image below shows.
The point here is: in this situation I'm able to see the specific requests which are alerting. However, there are cases it is not possible. I've realized some services are like that while others don't show this level of detail.
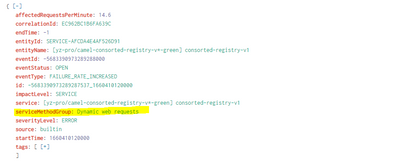
On the other hand, some services haven't got the "serviceMethod" field. Instead of it, these services comes with a field called "serviceMethodGroup". This scenario does not allow us to know which request is alerting specifically. (Of course there are other ways to figure it out. But I want to see in this way).
The image below shows the second scenario.
Is this something related to any configuration in Dynatrace? Or this level of detail will depend on our application that is being monitored?
Thank you in advance!
Solved! Go to Solution.
- Labels:
-
problems classic
- Mark as New
- Subscribe to RSS Feed
- Permalink
16 Aug 2022 06:59 AM
This depends on the meta data of the application that is being monitored.
- Mark as New
- Subscribe to RSS Feed
- Permalink
16 Aug 2022 01:13 PM
I know that, but they are all the same. I just cannot understand whether it is related to how our application has been built up or not.
I'm wondering if there is any other way to overcome this problem, like creating a service out of their requests or something like that.
- Mark as New
- Subscribe to RSS Feed
- Permalink
18 Aug 2022 07:47 AM
Its how the application is built up. The best practice is to assign custom tags!
- Mark as New
- Subscribe to RSS Feed
- Permalink
22 Aug 2022 09:53 PM - edited 22 Aug 2022 09:57 PM
I also think so.
Could you explain what would be this custom tags assignment? How would it help me?
Thank you.
- Mark as New
- Subscribe to RSS Feed
- Permalink
11 May 2023 01:10 PM
@techean can you help with that? 🙂
- Mark as New
- Subscribe to RSS Feed
- Permalink
15 May 2023 09:46 AM
Hey, believe you alreday found and answer.
You can apply automatic tags to the services by following steps in this link
or create new request attribute based on response data.
Or simply import logs of this application in Dynatrace using Logs
Featured Posts


