- Dynatrace Community
- Ask
- Cloud platforms
- Re: Azure - Azure Databricks Data Factory
- Subscribe to RSS Feed
- Mark Topic as New
- Mark Topic as Read
- Pin this Topic for Current User
- Printer Friendly Page
- Mark as New
- Subscribe to RSS Feed
- Permalink
22 Jun 2020
03:29 PM
- last edited on
17 Mar 2023
02:16 PM
by
![]() Ana_Kuzmenchuk
Ana_Kuzmenchuk
Hi,
is there any insight available on Dynatrace brought from Azure Monitor related to Azure Databricks and Data Factory? Do you have any experience getting this info from Azure?
Thanks in advance.
Alberto.
Solved! Go to Solution.
- Labels:
-
azure
- Mark as New
- Subscribe to RSS Feed
- Permalink
29 Jun 2020 12:23 PM
Hi Alberto,
Not yet, however support for Azure Data Factories should be available very soon. In fact this service is under active development right now.
Best,
Karolina
- Mark as New
- Subscribe to RSS Feed
- Permalink
20 Jan 2021 11:07 AM
Hi Karolina R. What is the status of support for Azure Databricks? Does Dynatrace plan to monitor Azure Databricks?
- Mark as New
- Subscribe to RSS Feed
- Permalink
25 Feb 2021 03:11 PM
Hi Luis,
Azure Data Factory monitoring is available as part of the Azure Monitor integration:
Sia
- Mark as New
- Subscribe to RSS Feed
- Permalink
25 Feb 2021 04:05 PM
Hi @Siavash H.., thank you for your reply. But what I need to know is if Dynatrace has planned to monitor Azure Databricks. And in that case, when would it be available and what can we expect from such monitoring (what aspects of Databricks would it monitor?).
Thank you, good day!.
- Mark as New
- Subscribe to RSS Feed
- Permalink
26 Feb 2021 12:19 PM
Hi Luis,
I am unable to find anything on the roadmap for Azure Databricks.
However, I had a look on the Azure documentation and it mentioned the ability to send Azure Databricks application logs using Log4j. In the new Log Monitor, Dynatrace offers generic log ingestion and log4j2 can be easily integrated directly to stream log directly from Databricks to Dynatrace.
I hope this helps. If you're looking for another ability to monitor Databricks I recommend to raise a product idea when the new Community is launched.
Sia
- Mark as New
- Subscribe to RSS Feed
- Permalink
26 Feb 2021 12:21 PM
Interesting, @Siavash H. Thanks a lot.
Can you share with me documentation about the new Log Monitor? I'm really interested in this new functionality.
Nice weekend, regards!
- Mark as New
- Subscribe to RSS Feed
- Permalink
26 Feb 2021 12:28 PM
Thanks, and you too Luis!
With regard to the new Log Monitor capabilities I think we'll announce something very soon.
Sia
- Mark as New
- Subscribe to RSS Feed
- Permalink
19 Jul 2021 05:20 PM
Any updates as to the new log monitor capabilities for Azure Databricks?
- Mark as New
- Subscribe to RSS Feed
- Permalink
17 Jan 2022 01:11 PM - edited 17 Jan 2022 01:11 PM
Hello everyone, i need to bring this topic back to life again, ¿any update?
- Mark as New
- Subscribe to RSS Feed
- Permalink
19 Jan 2022 09:14 PM
@apasoquen1 @CMolina as far as I know, Azure Databricks as a supporting service is still not on the roadmap. However, when it comes to log monitoring, our recent solution should support it, please check: https://www.dynatrace.com/support/help/how-to-use-dynatrace/infrastructure-monitoring/cloud-platform...
- Mark as New
- Subscribe to RSS Feed
- Permalink
05 Apr 2022 10:18 AM
Many Thanks wojciech_grajew
Please any technical document about Dynatrace capacities on Databricks monitoring (currently) will very useful.
On the other hand Any updates about Dynatrace roadmap?
Many Thanks
Damián
- Mark as New
- Subscribe to RSS Feed
- Permalink
05 Apr 2022 03:45 PM
Hello Damián,
Unfortunately right now I don't have any more documentation to share except for the link above. Regarding the roadmap, this service is not on it yet.
- Mark as New
- Subscribe to RSS Feed
- Permalink
05 Apr 2022 05:00 PM
Many Thanks wojciech_grajew for your feedback.
Please one additional question: my understanting is that Apache Spark platforms are supported by Dynatrace... so my question here are
- Dynatrace capacities for monitoring Apache Spark platforms are equivalents and available for Databricks or not ?
- Which are the monitoring capacities to be deployed by Dynatrace in order to consider a plataform (Databrick for instance) as "supporting service" ?
Kind regards
Damián
- Mark as New
- Subscribe to RSS Feed
- Permalink
06 Apr 2022 03:31 PM
Hi Damián,
I'm not an expert on Azure Databricks unfortunately. From what I see, Dynatrace supports monitoring Apache Spark through OneAgent:
https://www.dynatrace.com/support/help/technology-support/dynatrace-extensions/supported-out-of-the-...
As Databricks is a cloud service, I'd expect it to be a managed offering where you don't have access to the underlying instances where you could install OneAgent. You'd need to research it though.
Regarding the second question -- I'm not sure I understand. Supporting services is the name we give to the cloud services that Dynatrace can monitor through their public cloud APIs (making requests to Azure Resource Graph and Azure Monitor for example). They are monitored from ActiveGate and don't require OneAgent installation. Right now we plan to implement more supporting services but I don't think Databricks has high priority in this queue:
https://www.dynatrace.com/support/help/how-to-use-dynatrace/infrastructure-monitoring/cloud-platform...
- Mark as New
- Subscribe to RSS Feed
- Permalink
24 Jun 2022 10:15 AM - edited 29 Jun 2022 02:36 AM
Hi alberto-jesus_1,
You can monitor the Azure Databricks cluster nodes using OneAgent.
Steps:
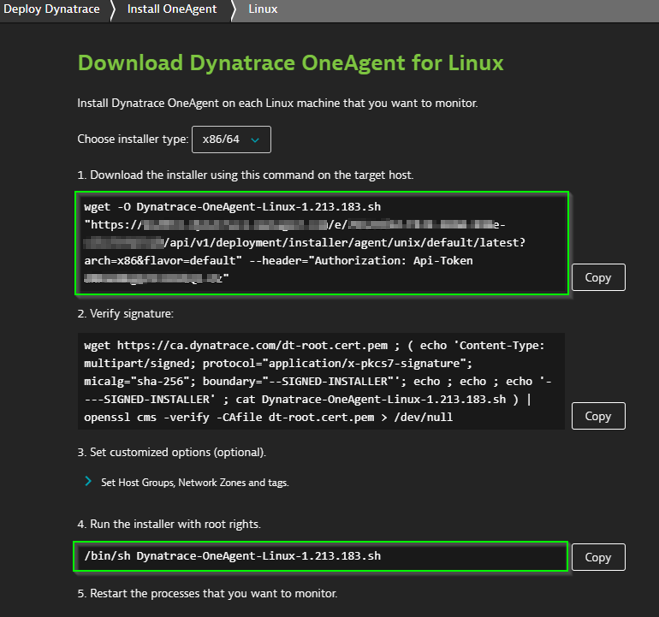
Navigate to the “Download Dynatrace OneAgent for Linux” screen in your Dynatrace environment and copy the 2 commands highlighted below to create a OneAgent install script.
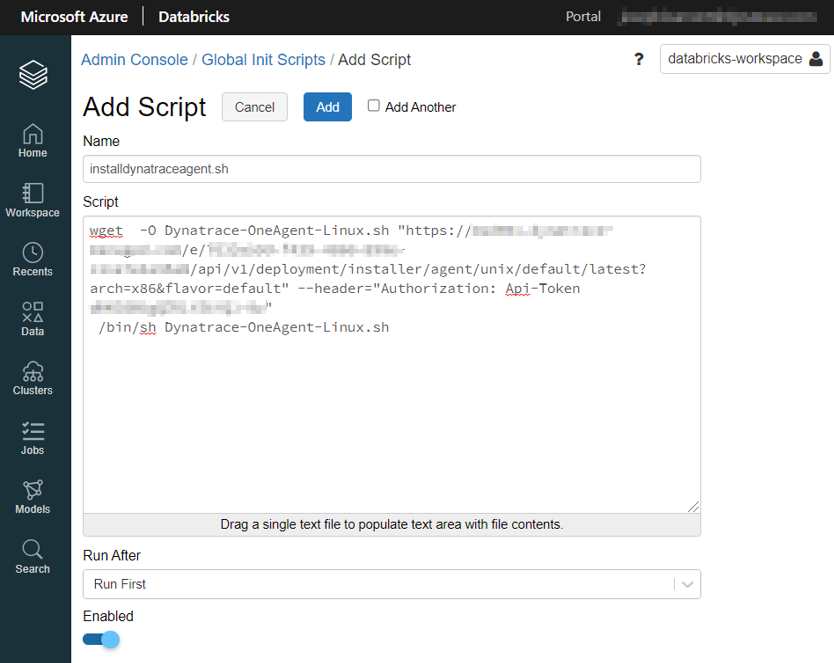
Paste the commands into a file to save for later, let’s refer to it as installdynatraceagent.sh. Cut out the 2 places where the agent version is specified so the latest version will always be used. Your script should look like this:
wget -O Dynatrace-OneAgent-Linux.sh "https://<domain>/e/xxxxxxx/api/v1/deployment/installer/agent/unix/default/latest?arch=x86&flavor=default" --header="Authorization: Api-Token xxxxxxxx"

 /bin/sh Dynatrace-OneAgent-Linux.sh --set-infra-only=true --set-app-log-content-access=true --set-host-group=<host_group>
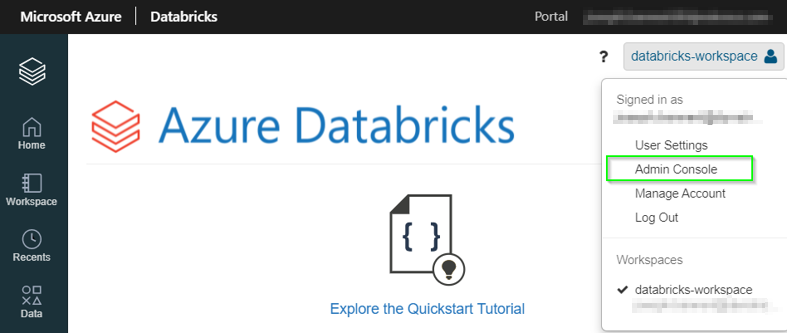
Navigate to your Azure Databricks workspace and go to the Admin Console.
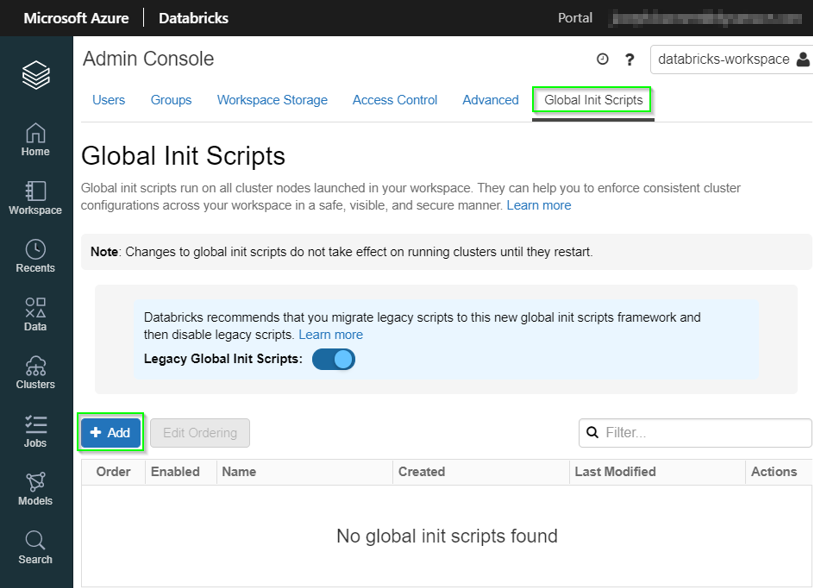
Select Global Init Scripts and click add.
Paste the name installdynatraceagent.sh and script we created earlier, select enabled and click add.
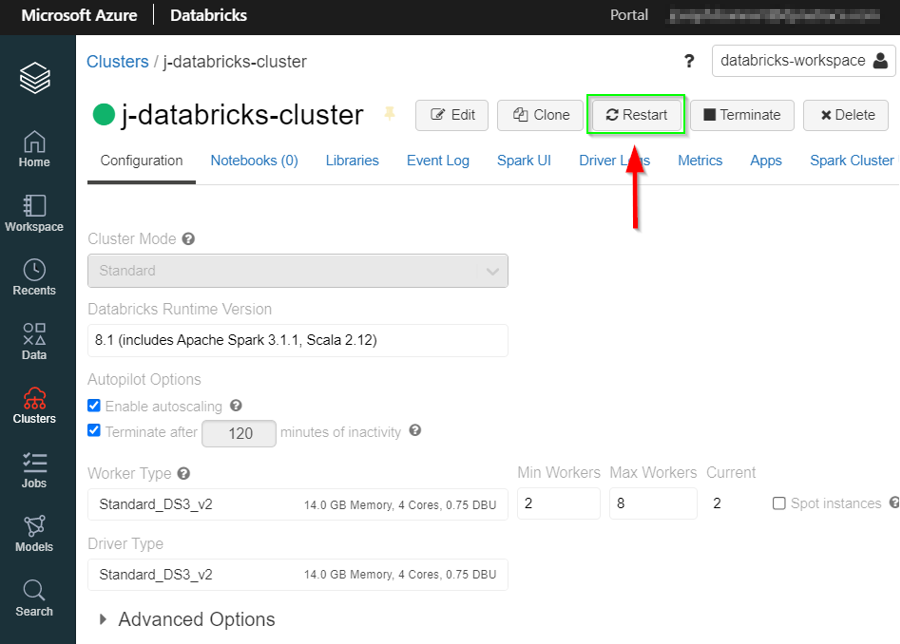
Now your clusters will automatically install OneAgent when they are created, for the OneAgent to be installed on clusters already running they will need to be restarted for the script to run.
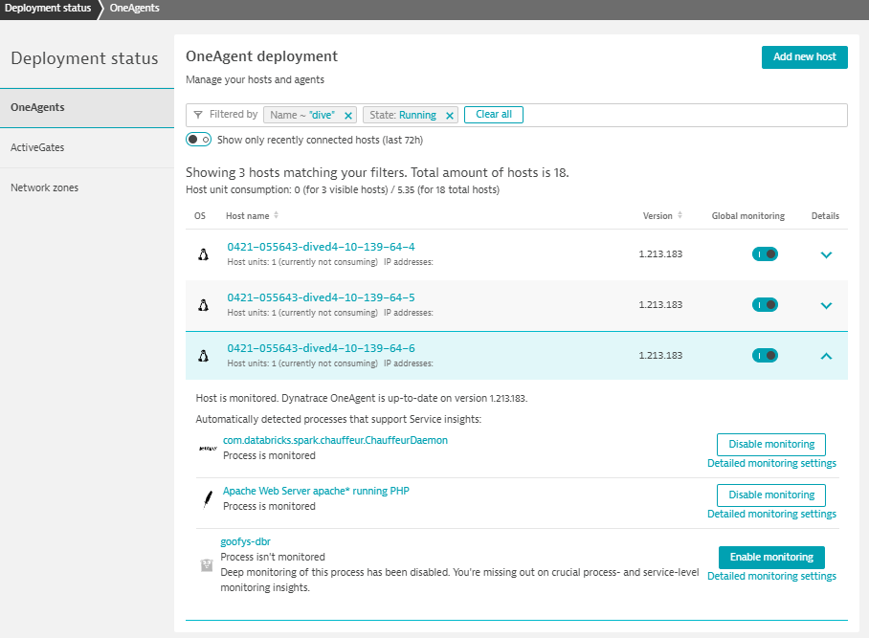
Done! You now should be able to see your Databricks cluster nodes as shown below in the deployment status.
Advisory notes:
- Your script should include a host group for the nodes, then in Dynatrace you need to turn off "Detect host or monitoring connection lost problems" on the host group level, this is to avoid an alert storm caused by frequent node termination.
- OneAgent should be used in infra only mode to save license because Databricks nodes typically have high RAM and full stack mode does not give much extra value.
Regards, Joe.
- Mark as New
- Subscribe to RSS Feed
- Permalink
18 Jul 2022 02:46 PM - edited 18 Jul 2022 02:48 PM
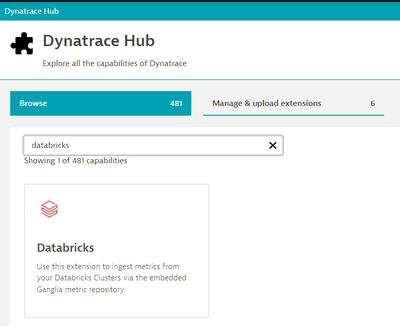
This is an awesome walkthrough for the OneAgent deployment to Databricks! We can also get deeper metric insight with various splittings via the Ganglia Extension as well for enhanced Datbricks AIOps from alerts and dashboard reports. The extension and instruction can be accessed from the in-product Dynatrace Hub or from the Public Dynatrace Hub. https://www.dynatrace.com/hub/detail/databricks/?query=databricks
- Mark as New
- Subscribe to RSS Feed
- Permalink
21 Feb 2023 10:19 PM
I have followed the instructions for Databricks extension v1.0.4 and I am not seeing any Ganglia metrics either in dashboard or in Metrics page
- Mark as New
- Subscribe to RSS Feed
- Permalink
21 Feb 2023 10:53 PM
All steps completed from the Details page, correct?
https://www.dynatrace.com/hub/detail/databricks/?query=databricks#details
- Mark as New
- Subscribe to RSS Feed
- Permalink
21 Feb 2023 11:02 PM - edited 21 Feb 2023 11:10 PM
Yes , the extension is configured in Dynatrace and GlobalInitscripts also updated in Databricks as per instructions. The cluster is visible in Dynatrace with OneAgent installed but no metrics for ganglia showing up
Featured Posts
