- Dynatrace Community
- Community
- Community challenges
- Re: Take the "Knowledge sharing" challenge!
- Subscribe to RSS Feed
- Mark Topic as New
- Mark Topic as Read
- Pin this Topic for Current User
- Bookmark
- Follow
- Mute
- Printer Friendly Page
Take the "Knowledge sharing" challenge!
- Mark as New
- Bookmark
- Follow
- Mute
- Subscribe to RSS Feed
- Permalink
30 Sep 2020 10:39 AM

Every day, your job probably requires you to navigate through different operating systems, browsers, and software. Knowing different shortcuts and methods can make you more productive. We encourage you to go through your experience with Dynatrace and reflect on the knowledge that makes your life with Dynatrace smoother!
Let’s share your best timesaving Dynatrace tips and tricks!
What have you discovered that made working with Dynatrace easier and faster? We want to know what have you done right before you said: “I can’t believe I didn’t know that!”.
Everyone that will share in this forum thread his tips and tricks knowledge will receive 200 reputation points!
- Labels:
-
community challenge
- Mark as New
- Bookmark
- Follow
- Mute
- Subscribe to RSS Feed
- Permalink
30 Sep 2020 01:27 PM
So in the past I would move tiles one by one to reorganize a layout. This also can be applied for cloning and or deleting tiles. Until a fellow co-worker showed me how to select multiple tiles at once!
If you left click and hold, you can select multiple desired tiles:

In addition to moving this set of tile selections, you can also... Clone them all, or Delete them all. Very useful when you need to adjust a dashboard by dropping everything down a line to allow for a new header or markdown tile.
This is such a simple yet very useful trick that after I was told about it, I said to myself “I can’t believe I didn’t know that!”.
For more Tips and Tricks check out these:
Pro Tip - How to use other colors in charts and graphs!
Pro Tip - Maximizing the Markdown Tile
- Mark as New
- Bookmark
- Follow
- Mute
- Subscribe to RSS Feed
- Permalink
30 Sep 2020 03:38 PM
Awesome, Chad! Thank you for sharing so valuable tips and reminding us of your past creation.
Well deserved + 200 points! 🙂
- Mark as New
- Bookmark
- Follow
- Mute
- Subscribe to RSS Feed
- Permalink
30 Sep 2020 02:18 PM
You may already know that dashboards are represented in configuration as simple json files. These are what you work with when configuring them through the API. An update recently made it possible to work with this json directly in the UI.
This makes it much faster to copy dashboards between environments or to copy or modify some sections in bulk. You can simply copy a dashboard from your QA to Prod environment and change filters etc... instead of trying to replicate the dashboard tile by tile. There's also the standard tricks you can do with text in a text editor such as find and replacing text for example if you wanted to find all occurrences of 'qa' and replace it with 'prod.'
Stuff like this had already been available through the API but with it in the UI you can make big changes in seconds especially if you keep configurations and conventions consistent across any environments you have.
- Mark as New
- Bookmark
- Follow
- Mute
- Subscribe to RSS Feed
- Permalink
30 Sep 2020 03:40 PM
Thanks, James for your tips. I believe for some of the newest Dynatrace users this can be a piece of very useful information!
+200 points 🙂
- Mark as New
- Bookmark
- Follow
- Mute
- Subscribe to RSS Feed
- Permalink
30 Sep 2020 03:29 PM
This may sound very basic but instead of refreshing your entire browser page, if you change the timeframe selector (or select the same timeframe again), the results will load/refresh much faster than a full reload of the page.
This is particularly useful for the non-custom chart pages (like service details, response time hotspots etc.)
- Mark as New
- Bookmark
- Follow
- Mute
- Subscribe to RSS Feed
- Permalink
30 Sep 2020 03:43 PM
Great tip, Ari! What is basic to one can be a discovery to someone else.
+ 200 points 🙂
- Mark as New
- Bookmark
- Follow
- Mute
- Subscribe to RSS Feed
- Permalink
30 Sep 2020 05:37 PM
Yes, this tip is one I also use a lot.
If you are navigating through a graph, using the arrows in the graph will be faster than in the time selector: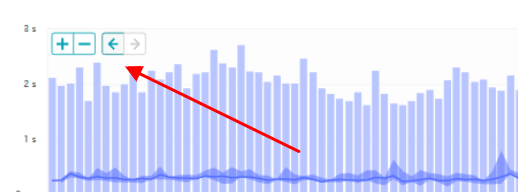
But normally you would want to refresh to get the latest data. That I sometimes do dragging the graph to the left, which should be faster than the time selector, given fewer XHRs are involved. Unfortunately, it does change the timeframe of the graph, and the details. Seems like a little bug...
- Mark as New
- Bookmark
- Follow
- Mute
- Subscribe to RSS Feed
- Permalink
30 Sep 2020 03:57 PM
Hi here are my tow cents .... 🙂
Try ctrl+shift+f9 with in dynatrace dashboards which will enable you to toggle auto refreshing on and off.
If "writing" about refresh, the rate of refresh is depend on the timeframe shown, as documentation explains:
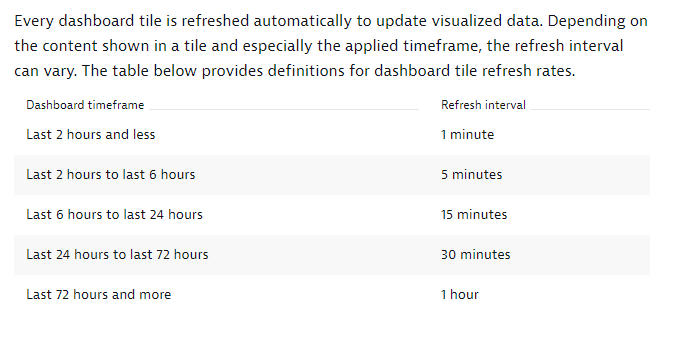
HTH
Yos
- Mark as New
- Bookmark
- Follow
- Mute
- Subscribe to RSS Feed
- Permalink
05 Oct 2020 06:55 AM
Awesome tip, thanks for sharing! +200! 🙂
- Mark as New
- Bookmark
- Follow
- Mute
- Subscribe to RSS Feed
- Permalink
30 Sep 2020 04:48 PM
Sometimes, I need to export the data that I'm seeing on a particular graph, but don't have the time to construct an API call to get it. So, I launch Developer Tools, hit refresh, and then check out the requests that are flowing. It will be pretty easy to detect normally, based simply on size and it being a XHR request. Copy&Paste the response through a JSON processor (I use jq) and out comes the data 🙂
- Mark as New
- Bookmark
- Follow
- Mute
- Subscribe to RSS Feed
- Permalink
05 Oct 2020 06:56 AM
Good to know, thanks, Antonio! +200 to reputation! 🙂
- Mark as New
- Bookmark
- Follow
- Mute
- Subscribe to RSS Feed
- Permalink
12 Oct 2020 10:17 PM
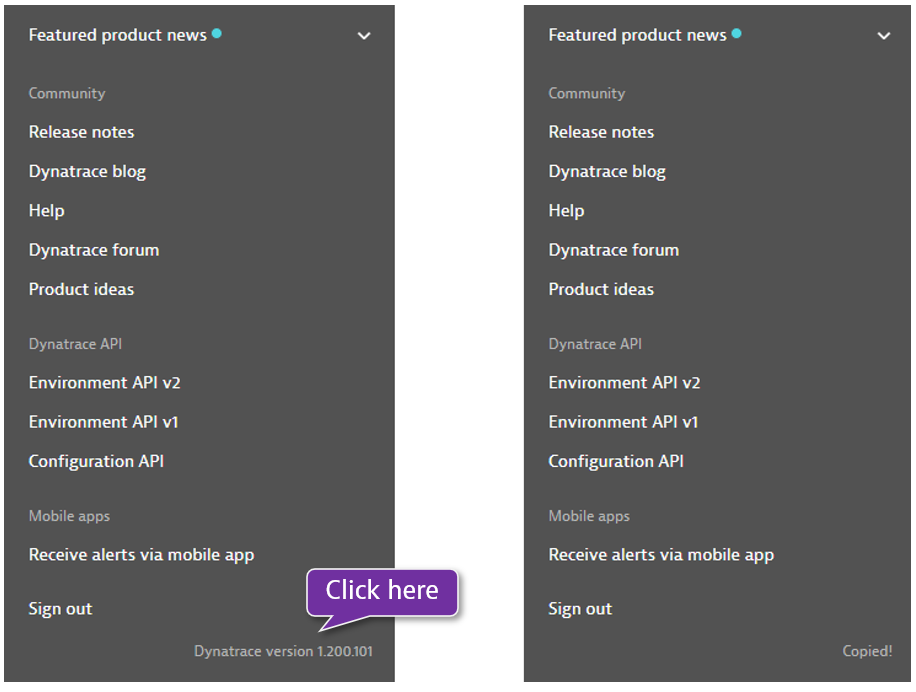
Here's my tip: if you open the User Menu and click in the "Dynatrace version" text at the bottom, you'll have copied the entire version of your server.
- Mark as New
- Bookmark
- Follow
- Mute
- Subscribe to RSS Feed
- Permalink
16 Oct 2020 11:18 AM
Wow, this is a nice sharing, thank you @Gabriel P.! +200 go to your reputation 🙂
- Mark as New
- Bookmark
- Follow
- Mute
- Subscribe to RSS Feed
- Permalink
13 Oct 2020 01:38 AM
We found a very simple way to manage our users' permissions with Dyntrace SSO. We have approximately 300 active users on Dynatrace and we are able to link the required permissions for each user automatically according to the user's group.
This allowed us to ensure that all new users automatically receive their required permissions.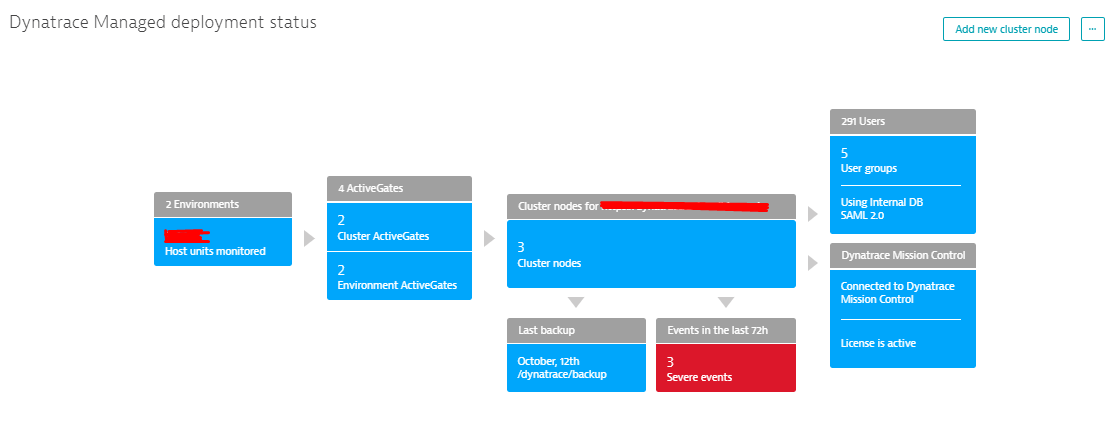
- Mark as New
- Bookmark
- Follow
- Mute
- Subscribe to RSS Feed
- Permalink
13 Oct 2020 01:18 PM
Can you clarify please? How did you implemented that?
Dynatrace Managed expert
- Mark as New
- Bookmark
- Follow
- Mute
- Subscribe to RSS Feed
- Permalink
13 Oct 2020 02:21 PM
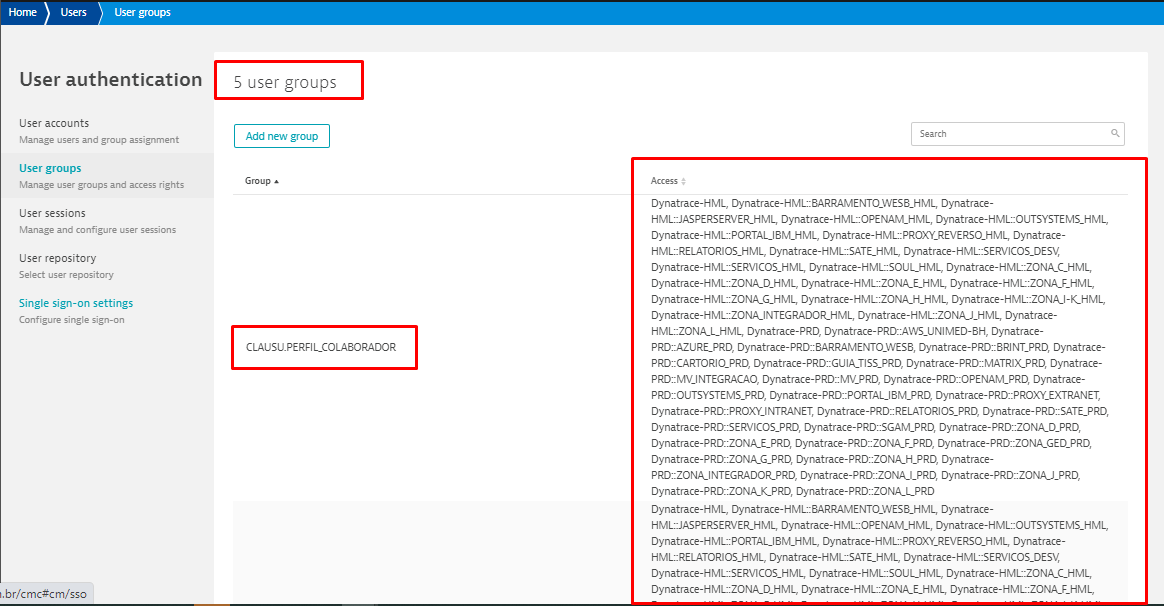
For each user profile I have (there are 5 in total) I have a group associated with the user in Active Directory.
During the SSO process, I inform Dynatrace of the attribute he will use to match the permissions on the Dynatrace side.
So, automatically, all users who need to access Dynatrace automatically already have a permission set because the attribute is found in their identity in Active Directory, which is the base where my SSO reads their permissions. (IDP).
- Mark as New
- Bookmark
- Follow
- Mute
- Subscribe to RSS Feed
- Permalink
13 Oct 2020 03:09 PM
perfect! .
Dynatrace Managed expert
- Mark as New
- Bookmark
- Follow
- Mute
- Subscribe to RSS Feed
- Permalink
16 Oct 2020 11:24 AM
Awesome @Leonard L. for sharing with us these tips with so many details. +200 reputation awarded 🙂
- Mark as New
- Bookmark
- Follow
- Mute
- Subscribe to RSS Feed
- Permalink
13 Oct 2020 08:37 AM
when we create dashboards with a lot of widgets, it may appear a glitch.
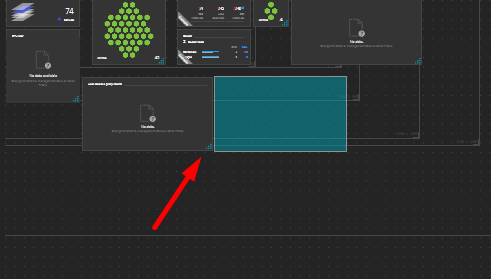
when moving widgets on the dashboard, it may happen that the widget does not want to move and lights up red, although in fact there is a place for it there
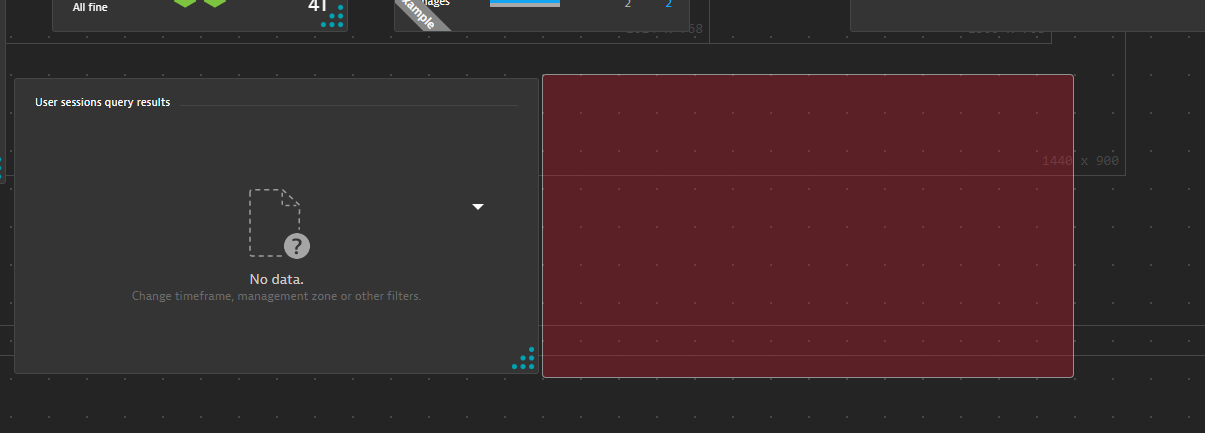
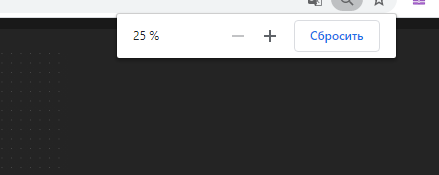
I noticed that in the chrome browser, dashboards are perfect built with a zoom of 50 or 25%
- Mark as New
- Bookmark
- Follow
- Mute
- Subscribe to RSS Feed
- Permalink
13 Oct 2020 08:42 AM
I also recommend paying attention to these labels, they help to create dashboards for a high-resolution screen
- Mark as New
- Bookmark
- Follow
- Mute
- Subscribe to RSS Feed
- Permalink
16 Oct 2020 11:17 AM
Thank you @Mikhail A.These are great un very valuable tips! + 200 points go to you 🙂
- Mark as New
- Bookmark
- Follow
- Mute
- Subscribe to RSS Feed
- Permalink
13 Oct 2020 01:23 PM
If you are unable to log-in to Dynatrace Managed configured with SSO-only page - because SSO is down or broken, you can use /admin path to log in with either admin or an internal user account. Then you can disable SSO or fix the issue.
Dynatrace Managed expert
- Mark as New
- Bookmark
- Follow
- Mute
- Subscribe to RSS Feed
- Permalink
16 Oct 2020 11:26 AM
Great tip @Radoslaw S., thanks for sharing! + 200 reputation points go to you 🙂
- Mark as New
- Bookmark
- Follow
- Mute
- Subscribe to RSS Feed
- Permalink
15 Oct 2020 09:17 AM
For me best timesaving feature is Dashboard API. I have set of generic dashboard that are my templates. We are Dynatrace partner so we have new Dynatrace implementations quite often. I'm using my templates as starting point. Most of them are made based on generic metrics so I only need to use Find - Replace function on text editor to modify tags assignment (when we use such filters). Really handy 🙂
Sebastian
- Mark as New
- Bookmark
- Follow
- Mute
- Subscribe to RSS Feed
- Permalink
15 Oct 2020 11:35 AM
that's smart 🙂 can you share your favorite template or the metrics you visualize the most often?
- Mark as New
- Bookmark
- Follow
- Mute
- Subscribe to RSS Feed
- Permalink
16 Oct 2020 11:25 AM
Happy to see you again more ofter in the forums @Sebastian K. and thanks for the tip. This definitely can save time! +200 points to your reputation 🙂
Featured Posts
