- Dynatrace Community
- Ask
- Container platforms
- How can we sum bytes received/sent from specific application inside openshift?
- Subscribe to RSS Feed
- Mark Topic as New
- Mark Topic as Read
- Pin this Topic for Current User
- Printer Friendly Page
- Mark as New
- Subscribe to RSS Feed
- Permalink
28 Sep 2021
11:18 AM
- last edited on
26 Oct 2021
10:29 AM
by
![]() fstekelenburg
fstekelenburg
Hello, friends!
Do Dynatrace have any capacity to monitor in/out traffic from a specific application and aggregate it by day/week/month .etc
We have an openshift cluster and one of our services download data from FTPS/S3 and also upload it back so I'm interested in seeing how much traffic was downloaded/uploaded by service today/yesterday .etc in total
for example:
we have serviceA() and what I wanna see is:
total bytes received today: 1GB
total bytes sent today: 2GB
If I asked question in the wrong place, please move it to the correct location, thx 🙂
Solved! Go to Solution.
- Labels:
-
openshift
- Mark as New
- Subscribe to RSS Feed
- Permalink
26 Oct 2021 08:08 AM
Hey @AlexJ ,
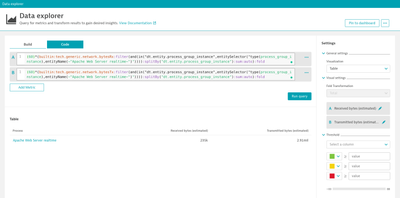
you can do that, however only on the process group instance level only. It's not possible to do it on the service level or request level. Dynatrace monitors process incoming and outgoing traffic on process only and it's only in rate (bytes/s). But you can use metric expressions to get an estimate:
This is however only an estimate based on the measured transmitted/received bytes rate.
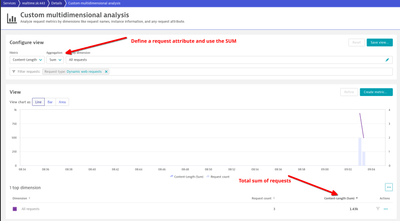
On the service level, if the request/response is an HTTP request and it contains a Content-Lengh header, you can define a request attribute and then use the value in the MDA chart for example or use the calculated service metric and then use it in Data Explorer:
Julius
Featured Posts


