This website uses Cookies. Click Accept to agree to our website's cookie use as described in our Privacy Policy. Click Preferences to customize your cookie settings.
Dashboarding
Dynatrace dashboards, notebooks, and data explorer explained.
Turn on suggestions
Auto-suggest helps you quickly narrow down your search results by suggesting possible matches as you type.
- Community Home
- Platform
- Dashboarding
- Creating chart from log analysis
Options
- Subscribe to RSS Feed
- Mark Topic as New
- Mark Topic as Read
- Pin this Topic for Current User
- Printer Friendly Page
Options
- Mark as New
- Subscribe to RSS Feed
- Permalink
11 Dec 2018
10:21 PM
- last edited on
31 Aug 2022
11:02 AM
by
![]() MaciejNeumann
MaciejNeumann
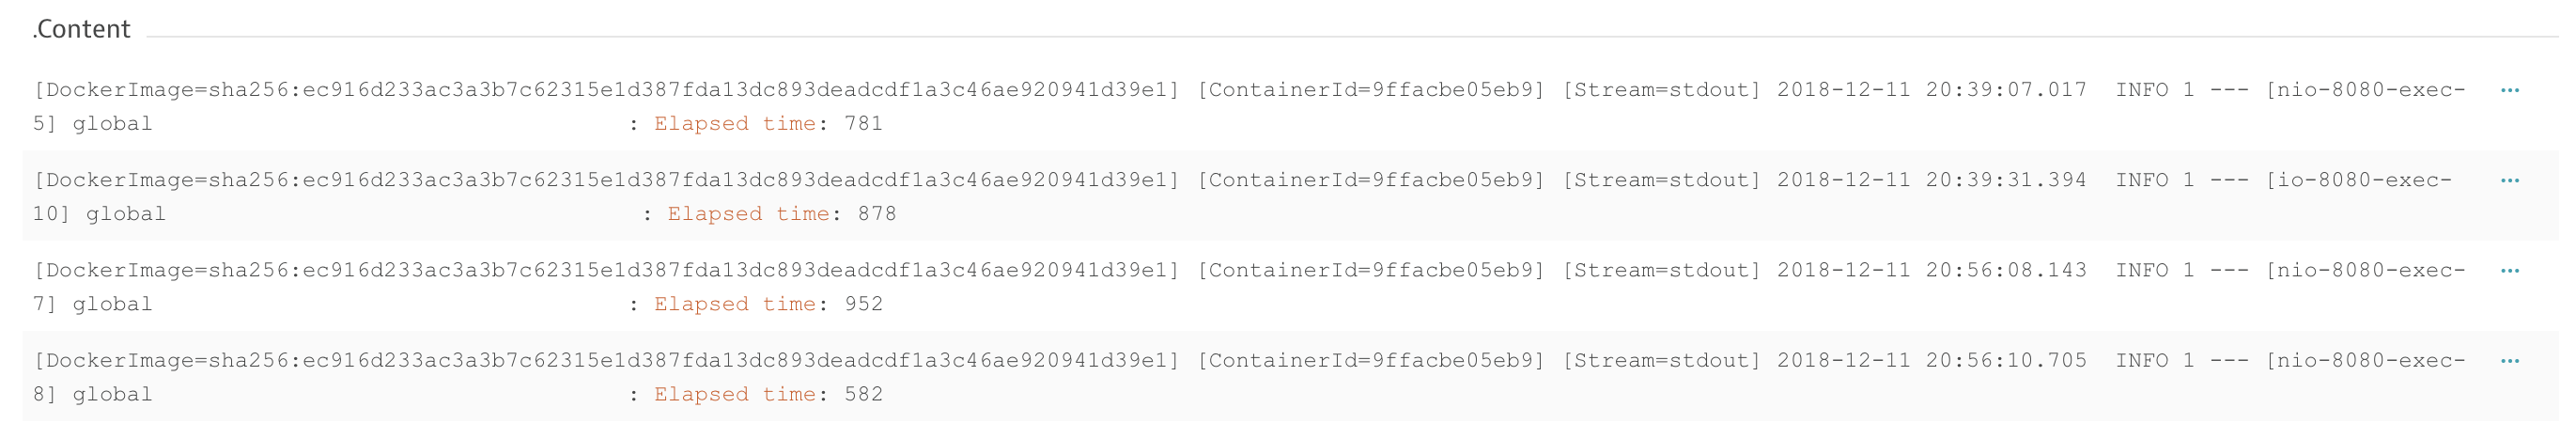
I created a sample Spring boot application that logs the elapsed time of a method call. I can view and query the log to get the metric. How can I put the elapsed time into a chart for the dashboard? Thanks.
Solved! Go to Solution.
Labels:
- Labels:
-
data explorer
-
log monitoring classic
Reply
4 REPLIES 4
Options
- Mark as New
- Subscribe to RSS Feed
- Permalink
11 Dec 2018 10:39 PM
I don't think it's possible right know. Values from log analytics are generally available for alerts, not for charting
Regards, Sebastian
Reply
Options
- Mark as New
- Subscribe to RSS Feed
- Permalink
11 Dec 2018 10:55 PM
Thanks for the answer Sebastian, appreciate your quick response
Options
- Mark as New
- Subscribe to RSS Feed
- Permalink
12 Dec 2018 10:09 AM
It is not possible via log files currently.
However, if that method is of particular interest to you, you could create a custom service for it.
Dynatrace Certified Master - Dynatrace Partner - 360Performance.net
Options
- Mark as New
- Subscribe to RSS Feed
- Permalink
01 Aug 2019 04:33 PM
Hi David,
is the process writing this log monitored by the Dynatrace OneAgent? If yes, you should be able to chart the response time of the method via service custom metric.
Extracting this metric out of a log is on our long term roadmap.
Peter
Reply
Featured Posts
