This website uses Cookies. Click Accept to agree to our website's cookie use as described in our Privacy Policy. Click Preferences to customize your cookie settings.
Dashboarding
Dynatrace dashboards, notebooks, and data explorer explained.
Turn on suggestions
Auto-suggest helps you quickly narrow down your search results by suggesting possible matches as you type.
- Community Home
- Platform
- Dashboarding
- DEM units consumption
Options
- Subscribe to RSS Feed
- Mark Topic as New
- Mark Topic as Read
- Pin this Topic for Current User
- Printer Friendly Page
Options
- Mark as New
- Subscribe to RSS Feed
- Permalink
18 Mar 2020
02:53 PM
- last edited on
31 Aug 2022
10:53 AM
by
![]() MaciejNeumann
MaciejNeumann
Hello All,
I hope you are all doing fine and safe.
I have a bit of a question, we want to start monitoring our DEM units consumption per application on a dashboard but i still can't fin a way to do it.
i wanted to extract the number of user sessions and divide it by 4 to get the number but i can't find a way to do it per application.
Does anyone have an idea how can i get a dashboard like this.
I'm also open to any suggestions about monitoring DEM units consumption feel free to share what you did in this case if you want.
Thank you
Solved! Go to Solution.
Labels:
- Labels:
-
dashboards classic
-
data explorer
-
licensing
5 REPLIES 5
Options
- Mark as New
- Subscribe to RSS Feed
- Permalink
18 Mar 2020
03:04 PM
- last edited on
16 Oct 2023
03:29 PM
by
![]() random_user
random_user
Hello!
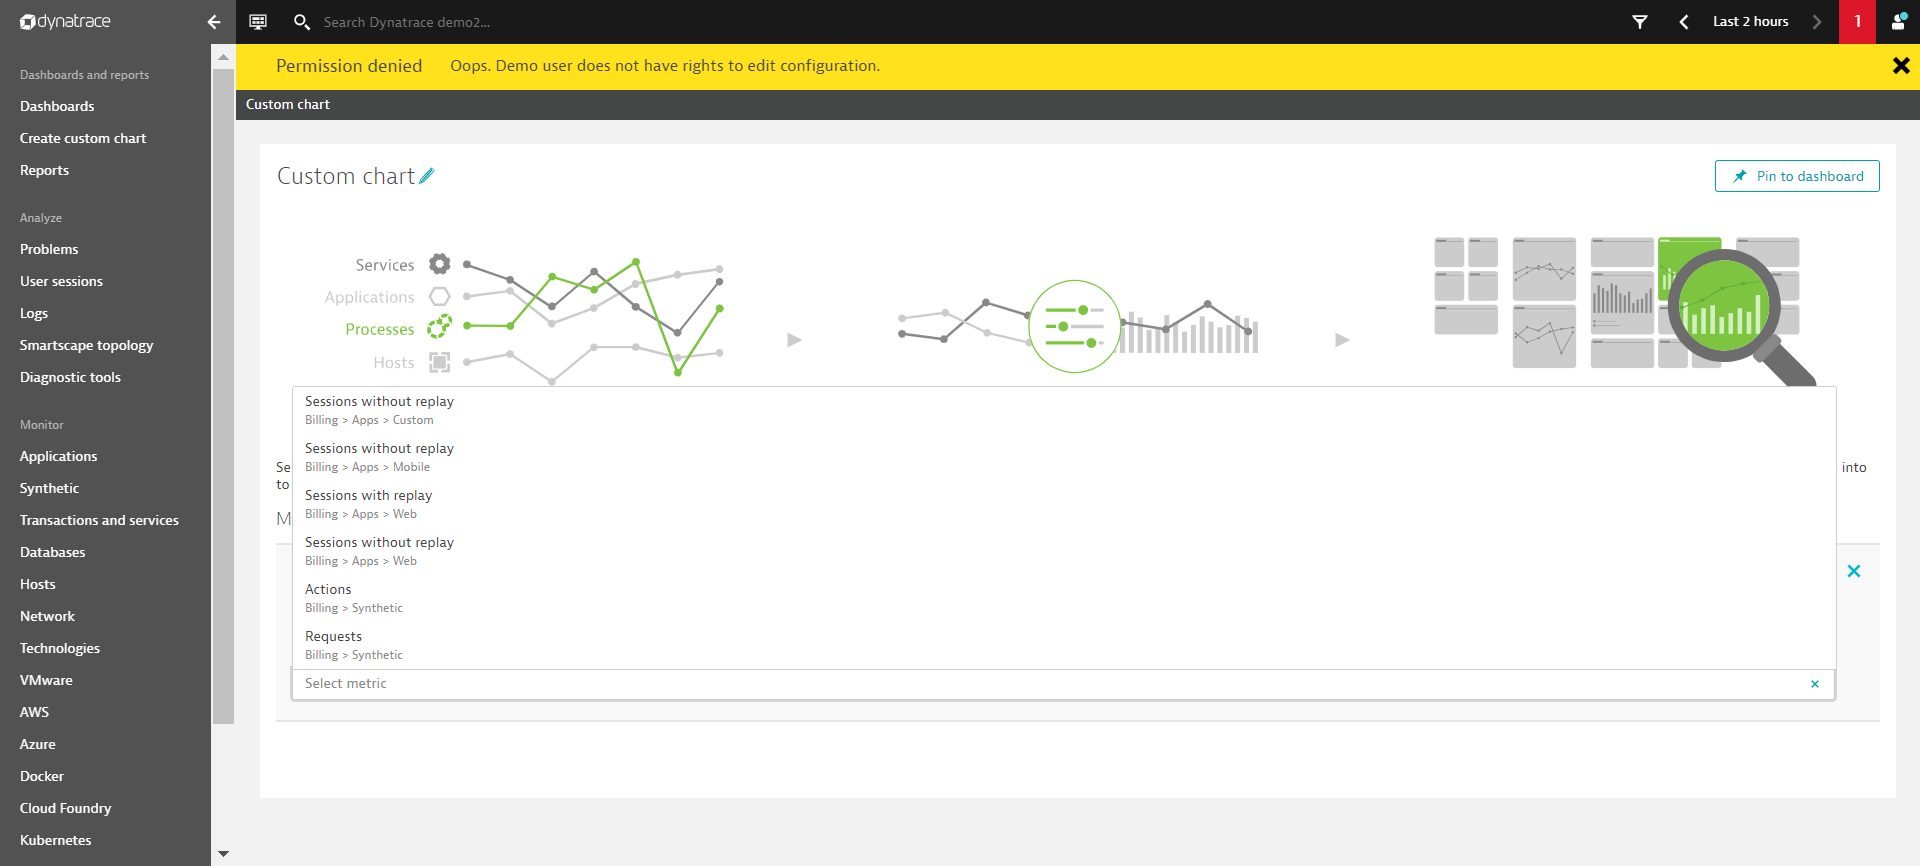
This can be accomplished through creating a custom chart with the "billing category". Then we would pin that custom chart to a dashboard.
You will notice "billed" vs "unbilled". This is explained in the following post around bounce rates and actual sessions collected.
-Michael
Reply
Options
- Mark as New
- Subscribe to RSS Feed
- Permalink
18 Mar 2020 03:20 PM
Thank you so much that was really helpful
So to get the DEM units consumption i should divide the number of billed sessions by 4
is there any way to get a chart with the DEM units consumption directly because here all i got is the session number
Options
- Mark as New
- Subscribe to RSS Feed
- Permalink
18 Mar 2020
03:32 PM
- last edited on
16 Oct 2023
03:29 PM
by
![]() random_user
random_user
That is correct!
Although the enhanced tracking through the API is on our Dev's Roadmap without an estimated ETA
I apologize for the inconvenience.
-Michael
Options
- Mark as New
- Subscribe to RSS Feed
- Permalink
11 Jul 2024 09:55 AM
By any chance, is the API to get consumptions are available now. I am specifically looking for dynatrace classic licensing model
Options
- Mark as New
- Subscribe to RSS Feed
- Permalink
11 Jul 2024 10:16 AM
You can use the billing metrics in the Metrics API v2.
Synthetic SME and community advocate.
Reply
Featured Posts
