- Dynatrace Community
- Ask
- Dashboarding
- Dashboard - pie chart with HTTP status code distribution
- Subscribe to RSS Feed
- Mark Topic as New
- Mark Topic as Read
- Pin this Topic for Current User
- Printer Friendly Page
- Mark as New
- Subscribe to RSS Feed
- Permalink
28 Nov 2022
12:11 PM
- last edited on
23 May 2023
11:57 AM
by
![]() Michal_Gebacki
Michal_Gebacki
Context:
There is a service that is integrated into Dynatrace and appears under the 'Service' category. That particular service is making HTTP calls to an endpoint that is not monitored by Dynatrace.
Problem:
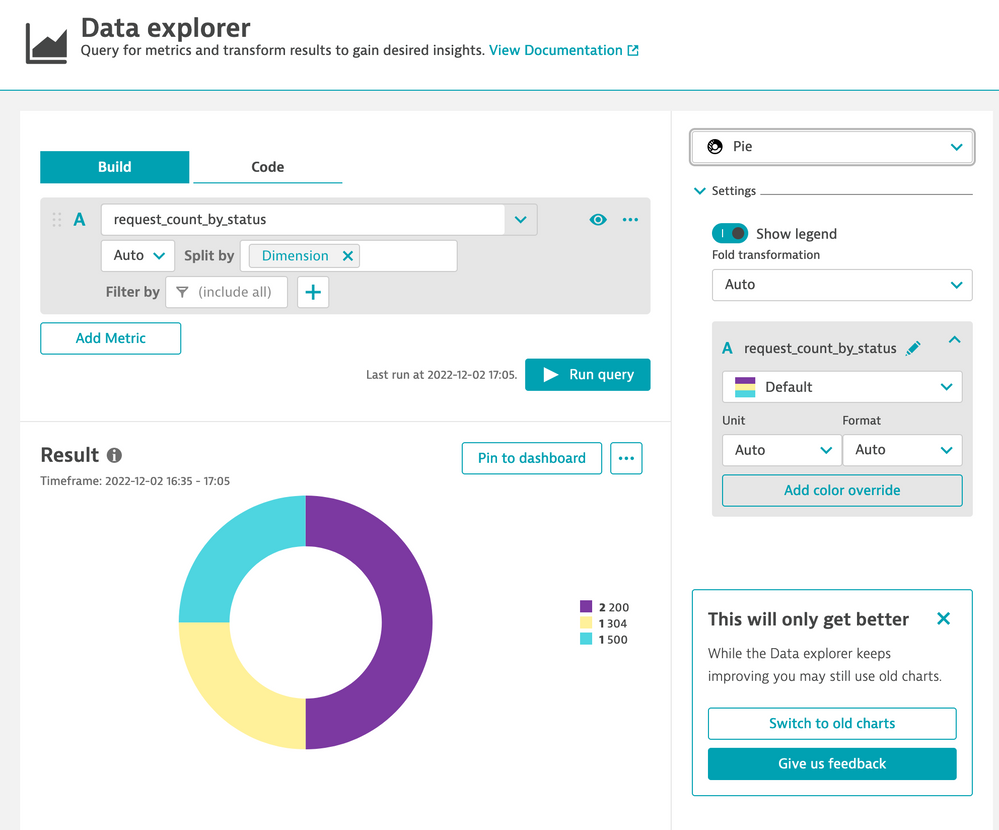
I would like to create a dashboard containing different kinds of charts related to the service interaction with the endpoint itself. I would like to create a pie chart that contains the HTTP status codes returned by that particular endpoint during a time period (last 24 hrs).
How can I create the pie chart? I did not find a useful metric that would help me achieve this.
Thank you
Solved! Go to Solution.
- Labels:
-
charts
-
dashboards classic
-
metrics
- Mark as New
- Subscribe to RSS Feed
- Permalink
28 Nov 2022 02:23 PM
Hi, @theAsker , good day.
You can make the call to the non monitored endpoint as a key request (https://www.dynatrace.com/support/help/how-to-use-dynatrace/services/analysis/monitor-key-requests), then you can use the keyrequest metrics (https://www.dynatrace.com/support/help/how-to-use-dynatrace/metrics/built-in-metrics#key-requests) to create the dashboard.
You can also work with Multidimensional Analysis, and create calculated service metric if the builtin metrics are not enough. https://www.dynatrace.com/support/help/how-to-use-dynatrace/diagnostics/multidimensional-analysis#ca...
Try and let us know.
- Mark as New
- Subscribe to RSS Feed
- Permalink
29 Nov 2022 05:48 AM
Thank you for the answer.
When looking at the key requests metrics I can only see an aggregation of status codes (number of 4xx, number of 5xx etc), I would like to have a pie chart with the distrbituion of all status codes. Is there a way to capture the actual http status code received?
- Mark as New
- Subscribe to RSS Feed
- Permalink
02 Dec 2022 08:09 PM
@theAsker, you can use the Multidimensional Analysis to achieve this:
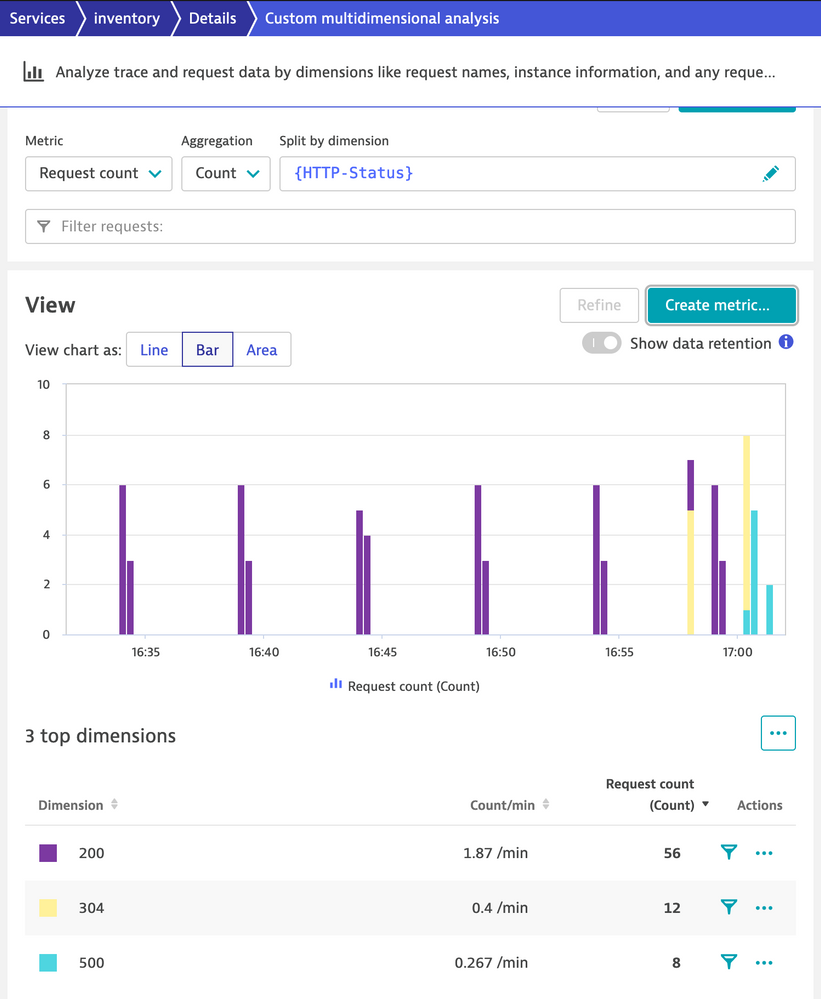
First you create a view using the HTTP Status as dimension.
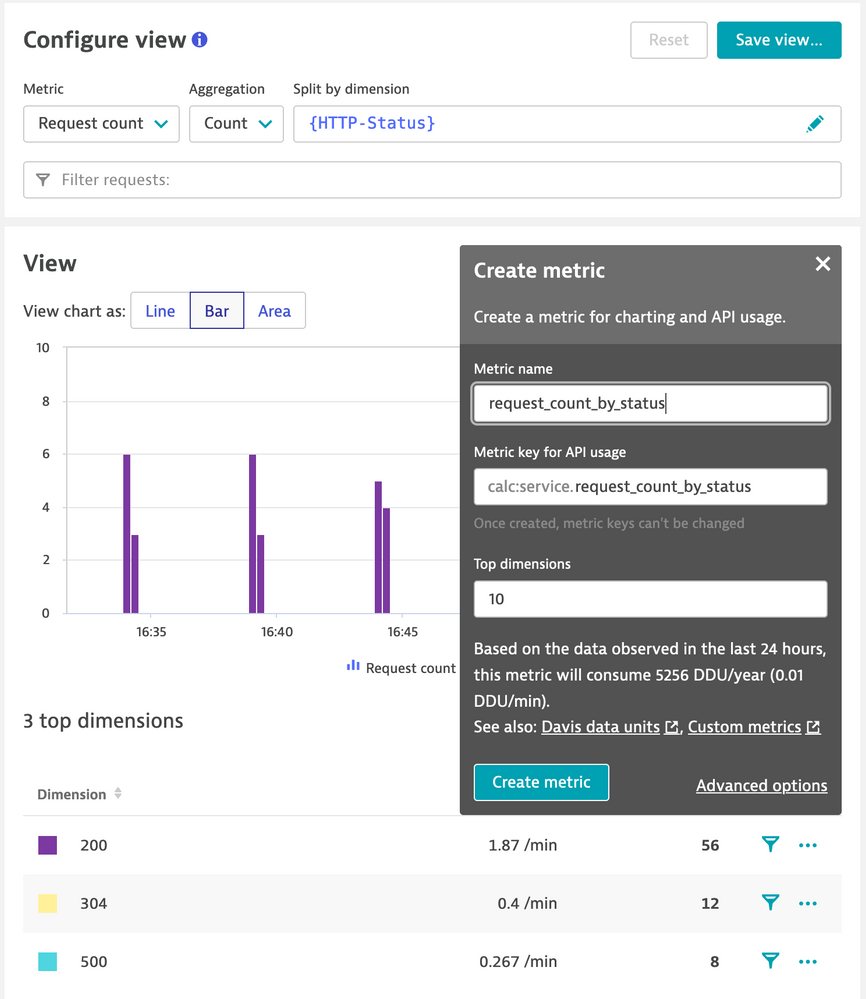
Then you create a calculated service metric.
Finally, you can use the metric to create your tile and pin to a dashboard.
- Mark as New
- Subscribe to RSS Feed
- Permalink
17 Feb 2023 02:04 PM
Why pay to create a custom metric for something that is already stored and viewable in multidimensional analysis ?
There is no logic behind it ?
Just a lack of a dimension on service/service_method metrics !
Featured Posts


