- Dynatrace Community
- Ask
- Dashboarding
- Re: Display limitations on Data Explorer Charts
- Subscribe to RSS Feed
- Mark Topic as New
- Mark Topic as Read
- Pin this Topic for Current User
- Printer Friendly Page
- Mark as New
- Subscribe to RSS Feed
- Permalink
12 Mar 2021
10:15 AM
- last edited on
31 Aug 2022
10:48 AM
by
![]() MaciejNeumann
MaciejNeumann
Hello,
I've been looking to use the Data Explorer to produce some simple information charts based on the 'JVM heap memory pool used bytes' metric. I was hoping that Data Explorer would fix some of the display short comings that have yet to be resolved in current Custom Chart tool.
The Use Case is, I've got 4 Hosts each running a 'jservice*.exe' process and I'm charting the 'JVM heap memory pool used bytes' for those 4 separate processes. This Metric is then filtered by the Process 'jservice*.exe' and the poolname, in this case 'PS Old Gen'. Quite straight forward.
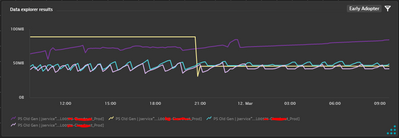
Using the Current Chart tool, if I display all 4 measures (1 measure per Host) for that 1 metric, it shows these measures but I've got the old issue that the Chart Key does not identify which chart line/measure belongs to which Host. An annoying and rather basic shortfall. As you can see one of the Processes is creeping up but from this chart I don't know which Host.
However, the Current Chart Tool does allow me to filter based on Tags so to get around this I can create one chart for each Host. Not ideal but it's the only way round the display limitation.
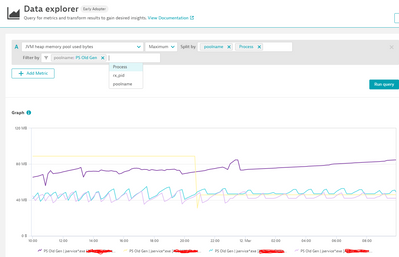
I then went to produce this same chart using the Data Explorer and found that the situation is more limited. The chart as before is filtered on Process and poolname. If I put all 4 measures on a single chart I've still got the same issue, that I can't identify which chart line/measure belongs to which Host.
But with Data Explorer I can't filter on anything else besides the Dimensions available to the Metric. I can't filter on a Tag so I have no way to show or identify which Host has the memory creep.
In fact this issue of not being able to identify which Process measure belongs to which Host has been an annoying limitation to the Cart tool and the design UI since day one. A frustrating limitation when being used to the AppMon Chart tools.
Can Dynatrace please resolve this old and basic limitation? Or does anyone know a way round this that doesn't involve using a Chrome Extension (Blocked by business).
Thanks
Solved! Go to Solution.
- Labels:
-
data explorer
- Mark as New
- Subscribe to RSS Feed
- Permalink
12 Mar 2021 04:30 PM
Hi,
With version 212 you get a lot more filters in the Explorer.
Regarding showing the host name along with the process name there I'd recommend creating an RFE
Fyi @christian_gusta
Omar
- Mark as New
- Subscribe to RSS Feed
- Permalink
06 Sep 2021 11:33 AM
If you click on Code tab, does adding ':parents' into the code help here? I would expect that to add host to the legend in this case.
Featured Posts


