- Dynatrace Community
- Dynatrace
- Ask
- Dashboarding
- Monitoring failure rates over a certain percentage
- Subscribe to RSS Feed
- Mark Topic as New
- Mark Topic as Read
- Pin this Topic for Current User
- Printer Friendly Page
- Mark as New
- Subscribe to RSS Feed
- Permalink
23 Feb 2023
08:37 AM
- last edited on
22 May 2023
02:32 PM
by
![]() Michal_Gebacki
Michal_Gebacki
Hi,
I work in the Incident response team and I'm looking for a way to highlight open failure rate problems where the failure rate is over a certain percentage. Maybe 5%. I was looking at creating an indicator on our Monitoring dashboard.
Is this possible? It's not for 1 or a few particular services but across the board. I want to simply display how many open 'failure rate increase' problems we have where the failure rate is over a certain percent.
Appreciate any feedback
Solved! Go to Solution.
- Mark as New
- Subscribe to RSS Feed
- Permalink
23 Feb 2023 09:48 AM
Hi,
You can use the failure rate metrics to achieve the same. And use the unit as percentage in the filter.
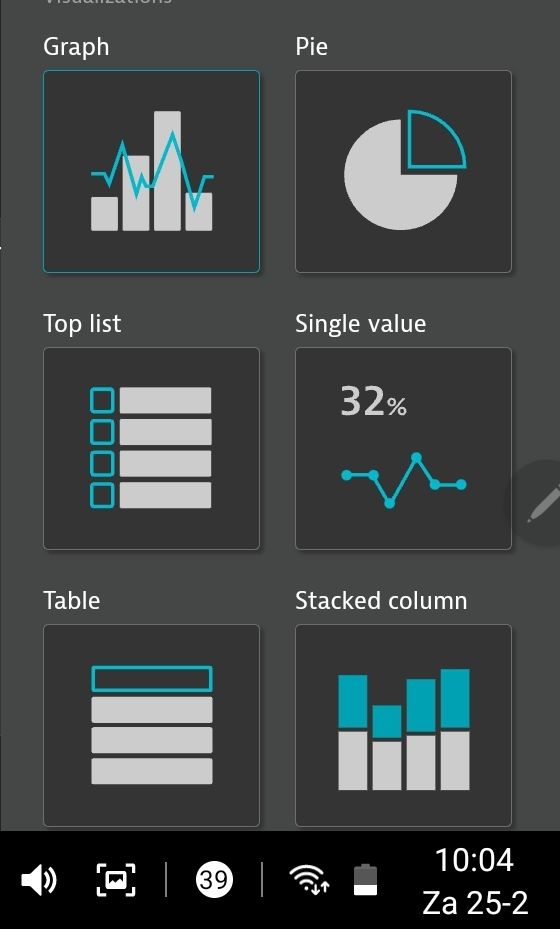
Also, try different visualization such as graph, table and set threshold value limit as well.
- Mark as New
- Subscribe to RSS Feed
- Permalink
23 Feb 2023 11:29 AM
Hi Selvam_Sekar, apologies but could you expand a little further. Is what you're suggesting done via a dashboard and if so what tile should i be using. Again I want an indicator to show me any problems where failure rate is above a certain threshold. Hopefully via a dashboard tile. I really appreciate any further advice on this.
- Mark as New
- Subscribe to RSS Feed
- Permalink
25 Feb 2023 09:08 AM
Hi,
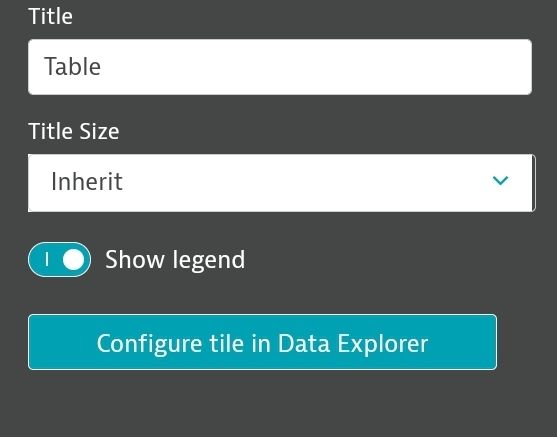
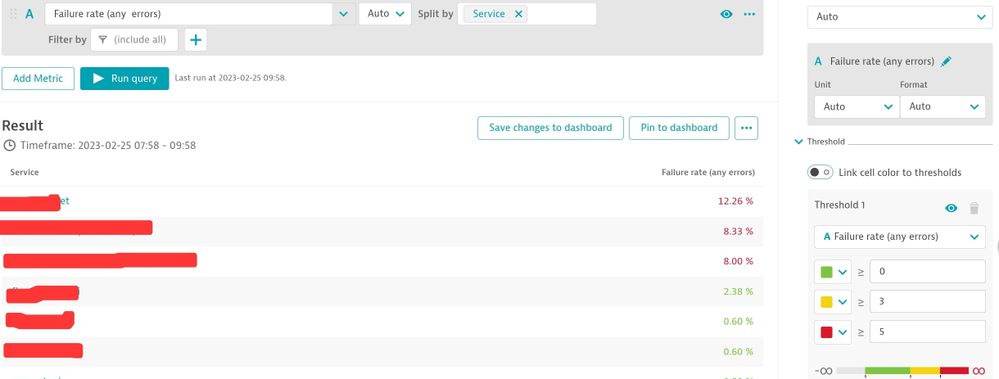
He is using the Data Explorer to get these metrics. From the data explorer you can use "Pin to Dashboard" to get it on a dashboard. Another option is to use the Dashboard Tiles (f.e. Graph or Table). While configuring this tile you can go to the Data Explorer and use all metrics available in Dynatrace.
If you want a list with requests that have a high failure rate you could use metric: Failure rate (any) and then work with the colors in the dashboard to give everything higher than 5% a red color in a Table tile:


