- Dynatrace Community
- Ask
- Dashboarding
- Finding the parent to a Cassandra rx_pid process ID
- Subscribe to RSS Feed
- Mark Topic as New
- Mark Topic as Read
- Pin this Topic for Current User
- Printer Friendly Page
- Mark as New
- Subscribe to RSS Feed
- Permalink
08 Jun 2022
05:14 PM
- last edited on
24 May 2023
03:30 PM
by
![]() Michal_Gebacki
Michal_Gebacki
Hi Dynatrace team,
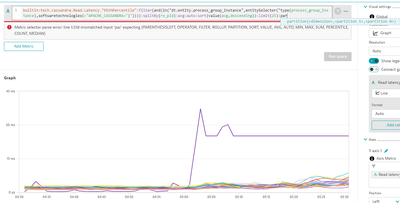
is there a way to easily determine the host in which a rx_pid lives within the tool? We can see one Cassandra process ID (9736) had a higher write and read latency during a load test. We'd like to easily find the server this process lives on so we can restart it without having to log in to each node. We see it's possible to find the parent to a Cassandra process (e.g. on metrics such as ReadRepair pending tasks) but not on other metrics such as Read latency 95th percentile, Write latency 95th percentile, or Compaction pending tasks).
On a weird side note, we did log in to each node and were unable to find this process ID.
Thank you,
Travis
Solved! Go to Solution.
- Mark as New
- Subscribe to RSS Feed
- Permalink
08 Jun 2022 05:43 PM
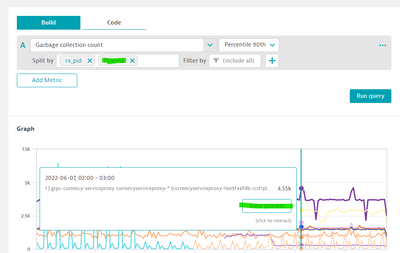
Try to add splitting by process and then when you will hover the line you will see in the tooltip of the line also a button to view the proccess that IMO will solve your request.
Here is an example for a different metric, because there is no Cassandra metric available in the demo environment, that with process split show the button
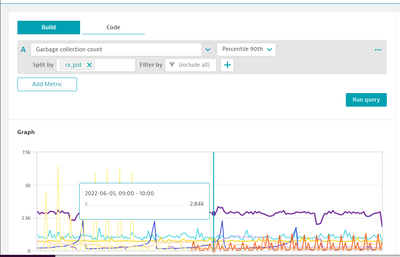
And with the split by process, not showing the view process button
HTH
Yos
- Mark as New
- Subscribe to RSS Feed
- Permalink
08 Jun 2022 05:53 PM
Ahh, interesting! Yup, that did it. Good catch. We can also get the parent from the process. Thinking about it more, we likely split it by pid initially because the parents() option wasn't yet available.
Thank you for the easy fix. I'll update all our graphs.
Featured Posts


