- Dynatrace Community
- Ask
- Dashboarding
- Get Dashboard data with Dynatrace Environment API 2.0
- Subscribe to RSS Feed
- Mark Topic as New
- Mark Topic as Read
- Pin this Topic for Current User
- Printer Friendly Page
- Mark as New
- Subscribe to RSS Feed
- Permalink
11 Mar 2020 07:21 AM
Hi all,
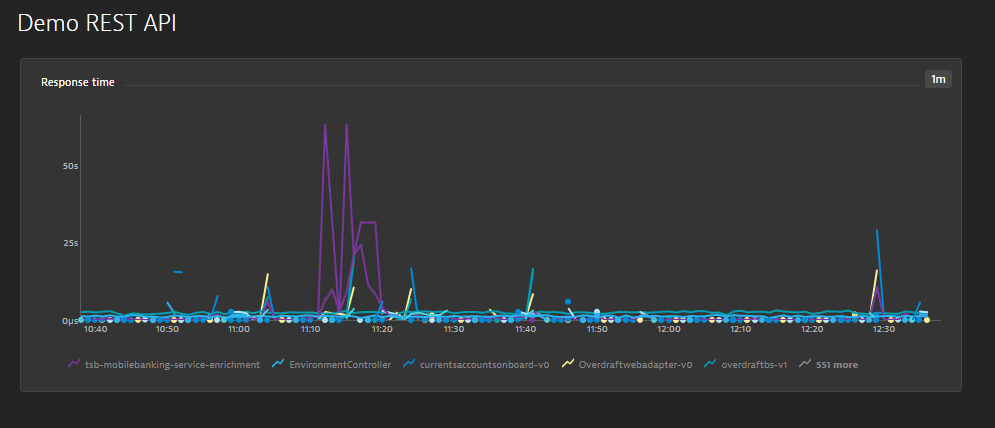
we have one Dashboard with the response time from several services:


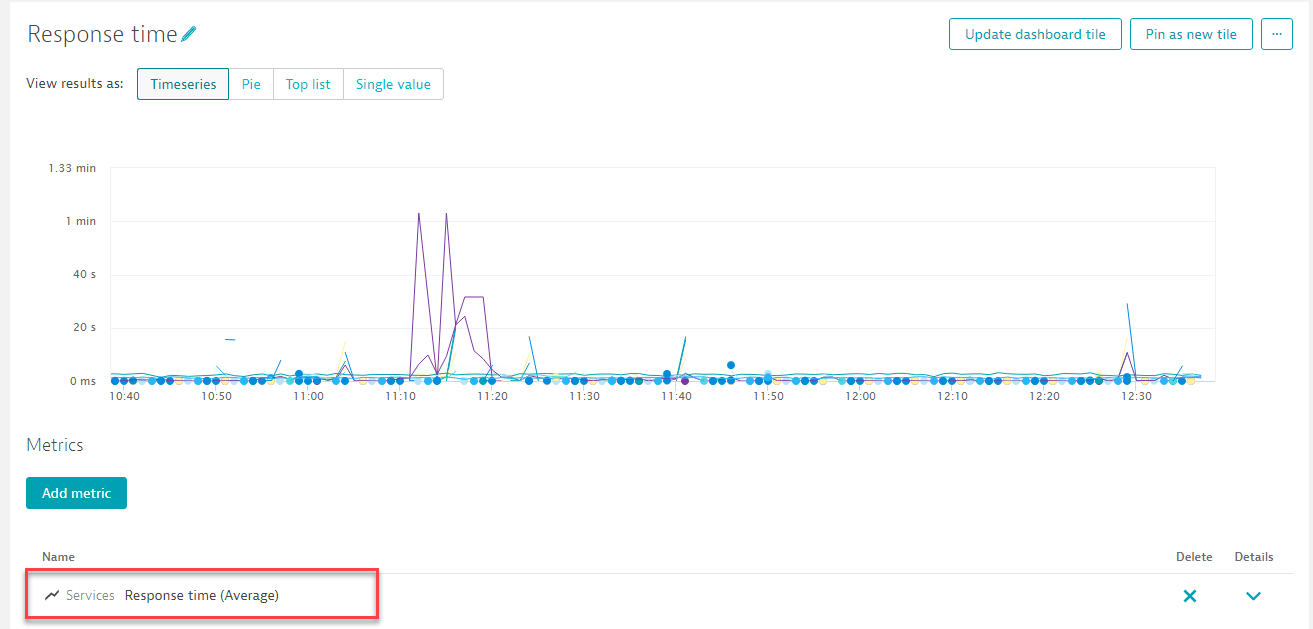
i want to get this information via REST API restricted to several timeframes. To do this one option (maybe not the best) was the Dynatrace Environment API 2.0 with the /metrics/query option.
I put in the metricSelector the value builtin:service.response.time and in the entitySelector I've to put the dashboard or the tile in the dashboard, ¿how can I specify it?
Regards, Josep Maria
Solved! Go to Solution.
- Labels:
-
dashboards classic
-
dynatrace api
- Mark as New
- Subscribe to RSS Feed
- Permalink
11 Mar 2020 07:36 AM
Hi,
I guess you should rather use entity IDs or tags whatever works for you. So you implement a REST query similar to what you build in the custom chart. Have a look on my example how I got CPU wait time metric for a given service:
api/v2/metrics/query?metricSelector=builtin%3Aservice.cpu.time&entitySelector=type%28SERVICE%29%2CentityId%28SERVICE-CC5FE0610A39BEF5%29" -H "accept: application/json; charset=utf-8"
More info here: https://www.dynatrace.com/support/help/extend-dynatrace/dynatrace-api/environment-api/metric-v2/get-...
Dynatrace Managed expert
- Mark as New
- Subscribe to RSS Feed
- Permalink
11 Mar 2020 08:37 AM
thanks for your response, but there's no type for the entity Dasboard? We've several dashboards with several filters and we've to provide this data via API.
To do that, the simplest way was to specify the dashboard or the tile inside the DB in the entitySelector?
Regards, Josep Maria
- Mark as New
- Subscribe to RSS Feed
- Permalink
11 Mar 2020 08:45 AM
There's no entity Dashboard - it's just a way of displaying the data, you might say.
As written in my comment, you can get exactly same data by the /query REST API and specifying same entities that you specify for you custom chart.
Dynatrace Managed expert
Featured Posts
