- Dynatrace Community
- Ask
- Dashboarding
- Re: Help Needed: Dashboarding Tips for Jetty Thread Metrics
- Subscribe to RSS Feed
- Mark Topic as New
- Mark Topic as Read
- Pin this Topic for Current User
- Printer Friendly Page
- Mark as New
- Subscribe to RSS Feed
- Permalink
02 Apr 2024 08:43 PM
Greetings,
I'm interested in learning better dashboarding practices in classic mode using expressions. I don't typically build many dashboards but I would like to have a few good ones that I can share with colleagues. For this thread I'm asking about JVM and Jetty pool metrics.
These metrics I'm referencing actually all come from Micrometer, a Dynatrace extension. We've set up our architecture so that teams can use our library to send Micrometer metrics through an ActiveGate to the Sandbox environment. This means that app teams can have dashboard dedicated to a locally running application, performance, and resiliency tests. Basically deep monitoring is enabled before deploying.
When is it appropriate to pair metrics on a single tile? (JVM, Jetty)
What kinds of thresholds make sense for these metrics?
What aggregations should I consider? (90th, 75th, count, max, sum)
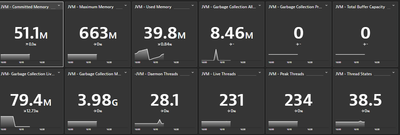
JVM Metrics in Single Value Format
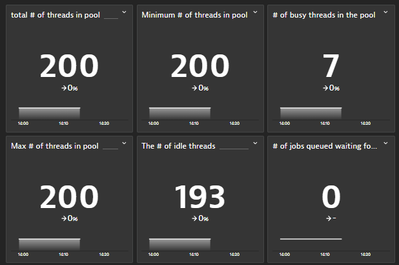
Jetty Thread Metrics in Single Value format
Solved! Go to Solution.
- Mark as New
- Subscribe to RSS Feed
- Permalink
02 Apr 2024 11:07 PM - edited 02 Apr 2024 11:09 PM
Hi @Nick-Montana,
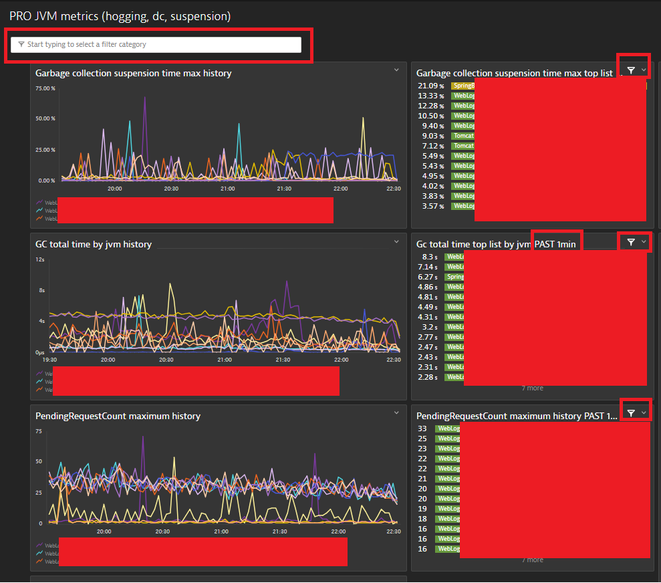
I have some general advices. At many cases at jvm metrics I use max aggregation, I use only min aggregation at "idle" type metrics. I recommend to use graphs and toplist or table together for the same metrics. Graphs should use the dashboard time frame and a toplist or table should have a custom very short time frame (1m). I really like use the timeframe transformstion also because I can see the actual metric value and a week before metric value. It can be usefull in case of incidents or compare the system perfromance after a change (before / after). Last but not least dashboard filters are are very usefull... jvm memory / thread metrics (stuck, hogging, standby, etc):
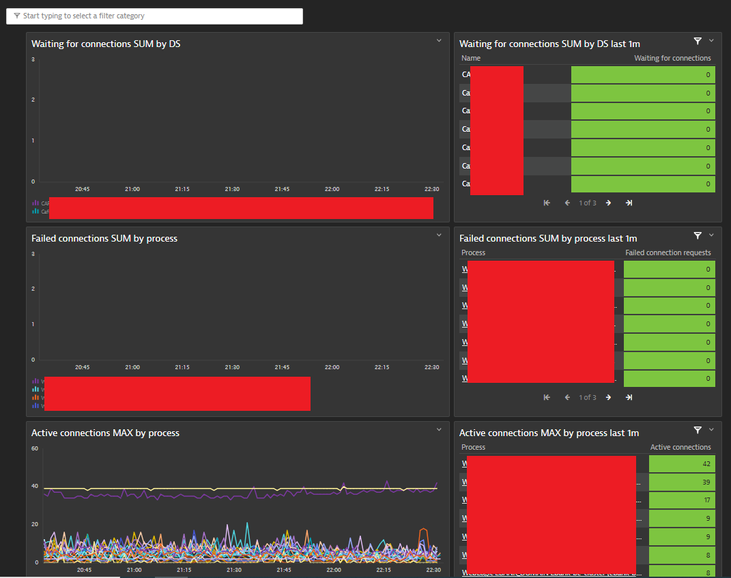
jvm connection pool metrics:
I hope it helps.
Best regards,
Mizső
- Mark as New
- Subscribe to RSS Feed
- Permalink
03 Apr 2024 04:10 PM
Thank you!
Are you able to provide the builtin metrics you are using on those tiles without giving away sensitive info?
- Mark as New
- Subscribe to RSS Feed
- Permalink
04 Apr 2024 07:46 AM
These are my favourite bulitin metrics for jvms.
builtin:tech.jvm.memory.gc.collectionTime - MAX
builtin:tech.jvm.memory.gc.suspensionTime - MAX
From jmx extensions Weblogic specific ones:
PendingRequestCount - MAX; StuckThreadCount - MAX; HoggingThreadCount- MAX; in case of dedicated workmanagers in Weblogic ExecutingThreadCount- MAX and DefferedThreadCount - MAX
Regarding connection pools (WL, Jboss, Tomcat) from the DT extesions: Waiting for connection - SUM and Failed connection - SUM
For Apache:
builtin:tech.webserver.threads.idle - MIN
builtin:tech.webserver.threads.active - MAX
I hope it helps.
Best regards,
Mizső
Featured Posts


