- Dynatrace Community
- Ask
- Dashboarding
- Re: How add Service CPU Usage % to dashboard
- Subscribe to RSS Feed
- Mark Topic as New
- Mark Topic as Read
- Pin this Topic for Current User
- Printer Friendly Page
- Mark as New
- Subscribe to RSS Feed
- Permalink
19 Apr 2021 04:47 PM
Hello
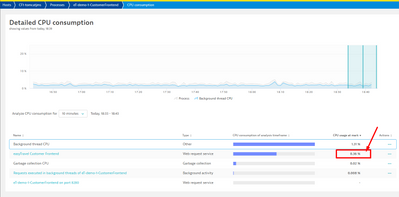
We need look Service CPU Usage % on dashboard
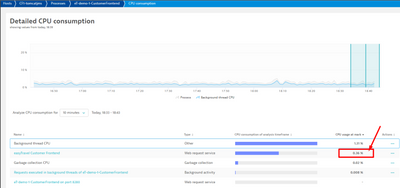
It metric available on Detailed CPU consumption page
How I can add it to Custom chart ?
Solved! Go to Solution.
- Labels:
-
dashboards classic
-
metrics
- Mark as New
- Subscribe to RSS Feed
- Permalink
19 Apr 2021 05:16 PM - edited 19 Apr 2021 05:17 PM
Hi @MAkimov
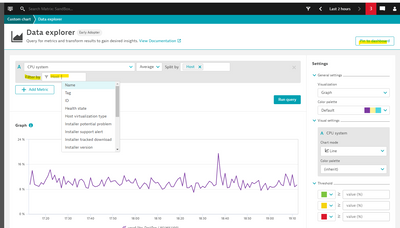
You can filter the metric builtin:host.cpu.system with host you are looking for and then pin it to the dashboard
HTH
Yos
- Mark as New
- Subscribe to RSS Feed
- Permalink
20 Apr 2021 07:26 AM
Hello @Yosi_Neuman
I do not need host.cpu.system !
I need service CPU usage %
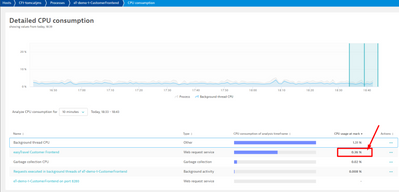
Metric which you can see on my screen for Detailed CPU consumption
Fot example for easyTravell Customer frontend
- Mark as New
- Subscribe to RSS Feed
- Permalink
20 Apr 2021 09:25 AM
Hello @andre_vdveen
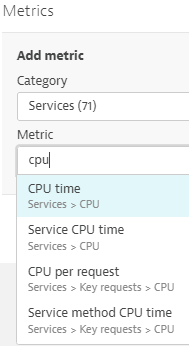
It is CPU time. We understand it metric
But we want have metric service CPU usage % on dashboard
see my screen
- Mark as New
- Subscribe to RSS Feed
- Permalink
07 Jun 2021 03:28 PM
Not sure if it helps, but your screenshot has Processes CPU Consumption, not Services.
Processes CPU consumption (and other metrics per Process) can be found under Technologies > Generic > CPU (or just put builtin:tech.generic.cpu.usage im Metric field)
- Mark as New
- Subscribe to RSS Feed
- Permalink
08 Jun 2021 01:33 PM
The Screen shot that was provided does indeed show the services. The view point is looking at a specific process, and the services running on that process. If the User were to click on 'easytravel customer frontend' that would transport them to the selected service.
- Mark as New
- Subscribe to RSS Feed
- Permalink
08 Jun 2021 01:31 PM
@MAkimov There isn't a way to target the CPU consumption of a Service as a dashboard Tile/Chart. You can tile/Chart the next level down which would be done by marking things as Key Requests. Keep in mind, marking key requests are always forward facing.
I would recommend putting in a RFE as the functionality that you are looking for does not exist in the product as of today from a dashboard view point.
As a work around, you can use a mark down tile and drop a link to the page that you want to access. But even then it wont show you values on the dashboard, rather just quick and easy access to the page.
- Mark as New
- Subscribe to RSS Feed
- Permalink
08 Mar 2023 10:52 AM
@MAkimov @ChadTurner As mentioned above is the feature of detecting "CPU consumption of a Service as a dashboard Tile/Chart" added ?
Please let me know if there is a way of doing this.
- Mark as New
- Subscribe to RSS Feed
- Permalink
08 Mar 2023 09:11 PM - edited 08 Mar 2023 09:13 PM
Hi @@lex-mascarenha,
Maybe you can try this metric expression. Maybe it is a completly worng way of thinking. Try it.
(builtin:tech.generic.cpu.usage:filter(and(or(in("dt.entity.process_group_instance",entitySelector("type(process_group_instance),entityName.equals(~"YOUR PG INSTANCE NAME~")"))))):splitBy():avg)
*(100*(builtin:service.cpu.time:filter(and(or(in("dt.entity.service",entitySelector("type(service),entityName.contains(~"YOUR SERVICE NAME~")"))))):splitBy():avg)
/builtin:tech.generic.cpu.groupTotalTime:filter(and(or(in("dt.entity.process_group",entitySelector("type(process_group),entityName.equals(~"YOUR PG NAME~")"))))):splitBy():avg)
/100
Last column is the above mentioned metric expression:
3rd column came from the first two with a % calculation, then I counted the 10,2% of the 21,59% which is the fifth column.
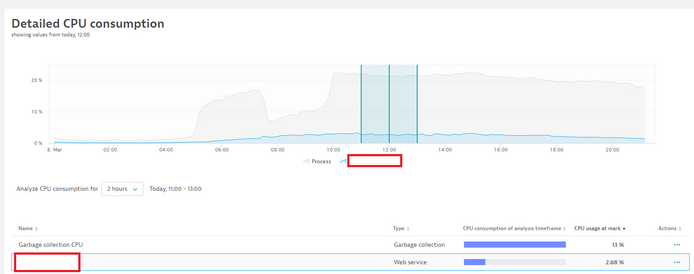
The above calculated process CPU detailed breakdown with the test service below. I know that 2,68 % is not 2,2% but it is quite close. I have tested it with randomly and the results are really quite close the CPU detailed breakdown values:
I hope it helps.
Best regards,
Mizső
- Mark as New
- Subscribe to RSS Feed
- Permalink
09 Mar 2023 06:27 AM
Hi @Mizső
Also thought about utilizing builtin:tech.generic.cpu.usage metric but @MAkimov asked to see the CPU% per service while this metric is showing the process CPU% and one process can run more then one service hence IMO its good answer but not for @MAkimov request 🤔.
Yos
- Mark as New
- Subscribe to RSS Feed
- Permalink
09 Mar 2023 07:46 AM
Hi @Yosi_Neuman,
I felt that my solution maybe not correct. I guess the checked services's CPU consumtion on my side in the CPU profiling were accidentally close to my calclulation.
Thanks for the correction.
Best regards,
Mizső
- Mark as New
- Subscribe to RSS Feed
- Permalink
12 Jan 2022 02:20 PM
@MAkimov did you open a RFE? i have the same "Problem" here. Regards, Urs
Featured Posts
