- Dynatrace Community
- Ask
- Dashboarding
- How to monitor for down/missing agents?
- Subscribe to RSS Feed
- Mark Topic as New
- Mark Topic as Read
- Pin this Topic for Current User
- Printer Friendly Page
- Mark as New
- Subscribe to RSS Feed
- Permalink
18 Apr 2023
06:20 PM
- last edited on
30 May 2023
07:25 AM
by
![]() MaciejNeumann
MaciejNeumann
I am working on standing up an Infrastructure-only environment. There does not appear to be an infrastructure-only based dashboard so I'm having to create my own. One of the things we need to know is how many systems are registered and whether they have active agents, so that if an agent stops reporting for whatever reason we can get a notification about it and go check it out and fix it.
So two questions, I guess:
- Is there an infrastructure-only dashboard that I can pull up and build from, or am I totally on my own?
- What tile and data source should I be using to track the data I mentioned above (registered systems w/running agents)?
Solved! Go to Solution.
- Mark as New
- Subscribe to RSS Feed
- Permalink
18 Apr 2023 06:48 PM - edited 18 Apr 2023 06:49 PM
- Mark as New
- Subscribe to RSS Feed
- Permalink
18 Apr 2023 07:55 PM
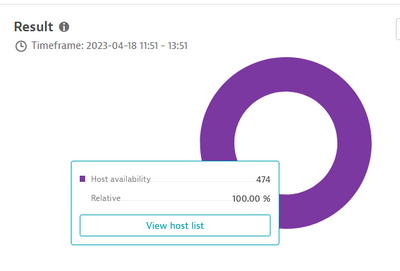
I created a pie chart tile, with the data source of 'host availability'. I currently have 8 systems with an agent on them.. why is it reporting 457 hosts, and if I show 'view host list' I get the expected 8 systems.
- Mark as New
- Subscribe to RSS Feed
- Permalink
19 Apr 2023 08:26 AM
Hi,
You can split metric by "Host" and "availability.state" to see every host and his state. I would recommend to change format to table:
Best regards
- Mark as New
- Subscribe to RSS Feed
- Permalink
18 Apr 2023 08:44 PM
Hi @Norman,
you can check the link shared by @AntonPineiro to get a full understanding of the Host availability states.
as for creating a dashboard, don't worry you are not on your own, you can access Dynatrace demo live environment (https://{environmentid}.live.dynatrace.com/), there are a lot of dashboards created by different users and experts, and you can check the dashboards, export any dashboard then import it to your environment
and, you can use BizOpsConfigurator https://dynatrace.github.io/BizOpsConfigurator/ to get some awesome dashboards.
also, I've created a simple dashboard for Hosts, you can use it and adjust/add more tiles based on your requirements, you will find two tiles for problems one filtered for "Host or monitoring unavailable Problems" and the other problem tile filtered for other availability and resource problems
Featured Posts


