- Dynatrace Community
- Ask
- Dashboarding
- Re: Hung Threads and connection pool for .NET applications
- Subscribe to RSS Feed
- Mark Topic as New
- Mark Topic as Read
- Pin this Topic for Current User
- Printer Friendly Page
- Mark as New
- Subscribe to RSS Feed
- Permalink
09 Apr 2018
04:42 PM
- last edited on
31 Aug 2022
11:02 AM
by
![]() MaciejNeumann
MaciejNeumann
Hi,
I would like to chart hung threads and connection pool size for .NET applications in dynatrace.Can someone help me with this.
Thanks,
Solved! Go to Solution.
- Labels:
-
data explorer
-
dotnet
- Mark as New
- Subscribe to RSS Feed
- Permalink
09 Apr 2018 07:47 PM
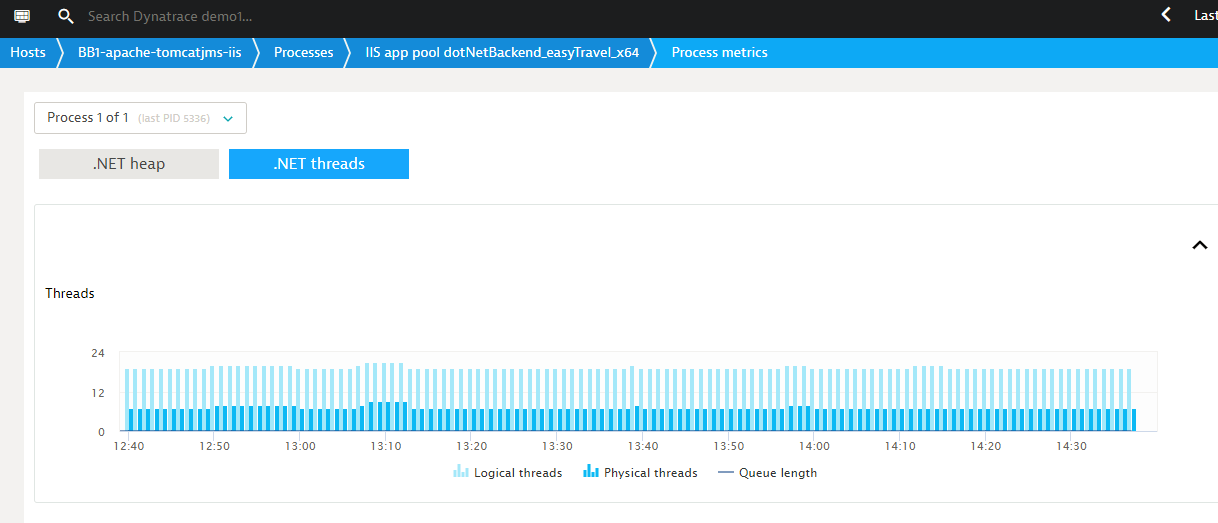
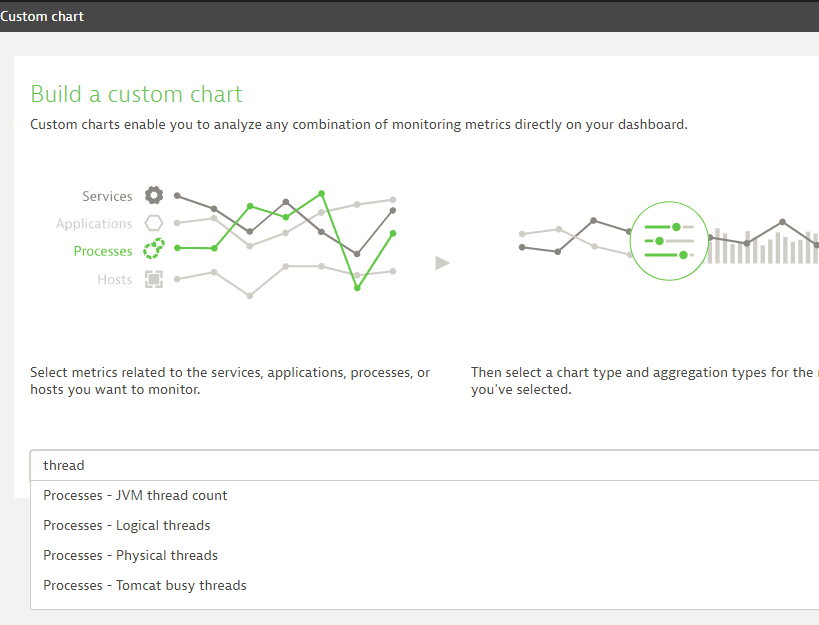
What metrics are available now will be available if you browse through the options under "create custom chart" or by drilling into the details for a given process:


At least in our demo I don't see anything for hung threads.
James
- Mark as New
- Subscribe to RSS Feed
- Permalink
05 Apr 2019 02:26 PM
With OneAgent 1.165, there are new .NET Thread Pool metrics, that would show you a starvation of threads in the thread pool. .NET Core 2.0+ only.

- Mark as New
- Subscribe to RSS Feed
- Permalink
24 Apr 2019 08:10 PM
@Christoph N.I got a request from a prospect in a PoC for a rather big deal if we can also show the thread contention rate? (apparently the competing product can show it and they are very into this particular metric)
- Mark as New
- Subscribe to RSS Feed
- Permalink
20 Mar 2024 04:32 PM
I am running a .Net 6 app and we have min/max threadpool settings as 100/250. our graph in dynatrace shows a fraction of an active worker thread usually. Why is that?
Featured Posts
