- Dynatrace Community
- Ask
- Dashboarding
- JVM process group metrics in Dynatrace Managed
- Subscribe to RSS Feed
- Mark Topic as New
- Mark Topic as Read
- Pin this Topic for Current User
- Printer Friendly Page
- Mark as New
- Subscribe to RSS Feed
- Permalink
27 Jun 2018
09:50 AM
- last edited on
19 Jan 2022
08:22 AM
by
![]() AgataWlodarczyk
AgataWlodarczyk
Hi, is there any way of displaying JVM metrics (committed and used memory) on a top-level dashboard for a process group?
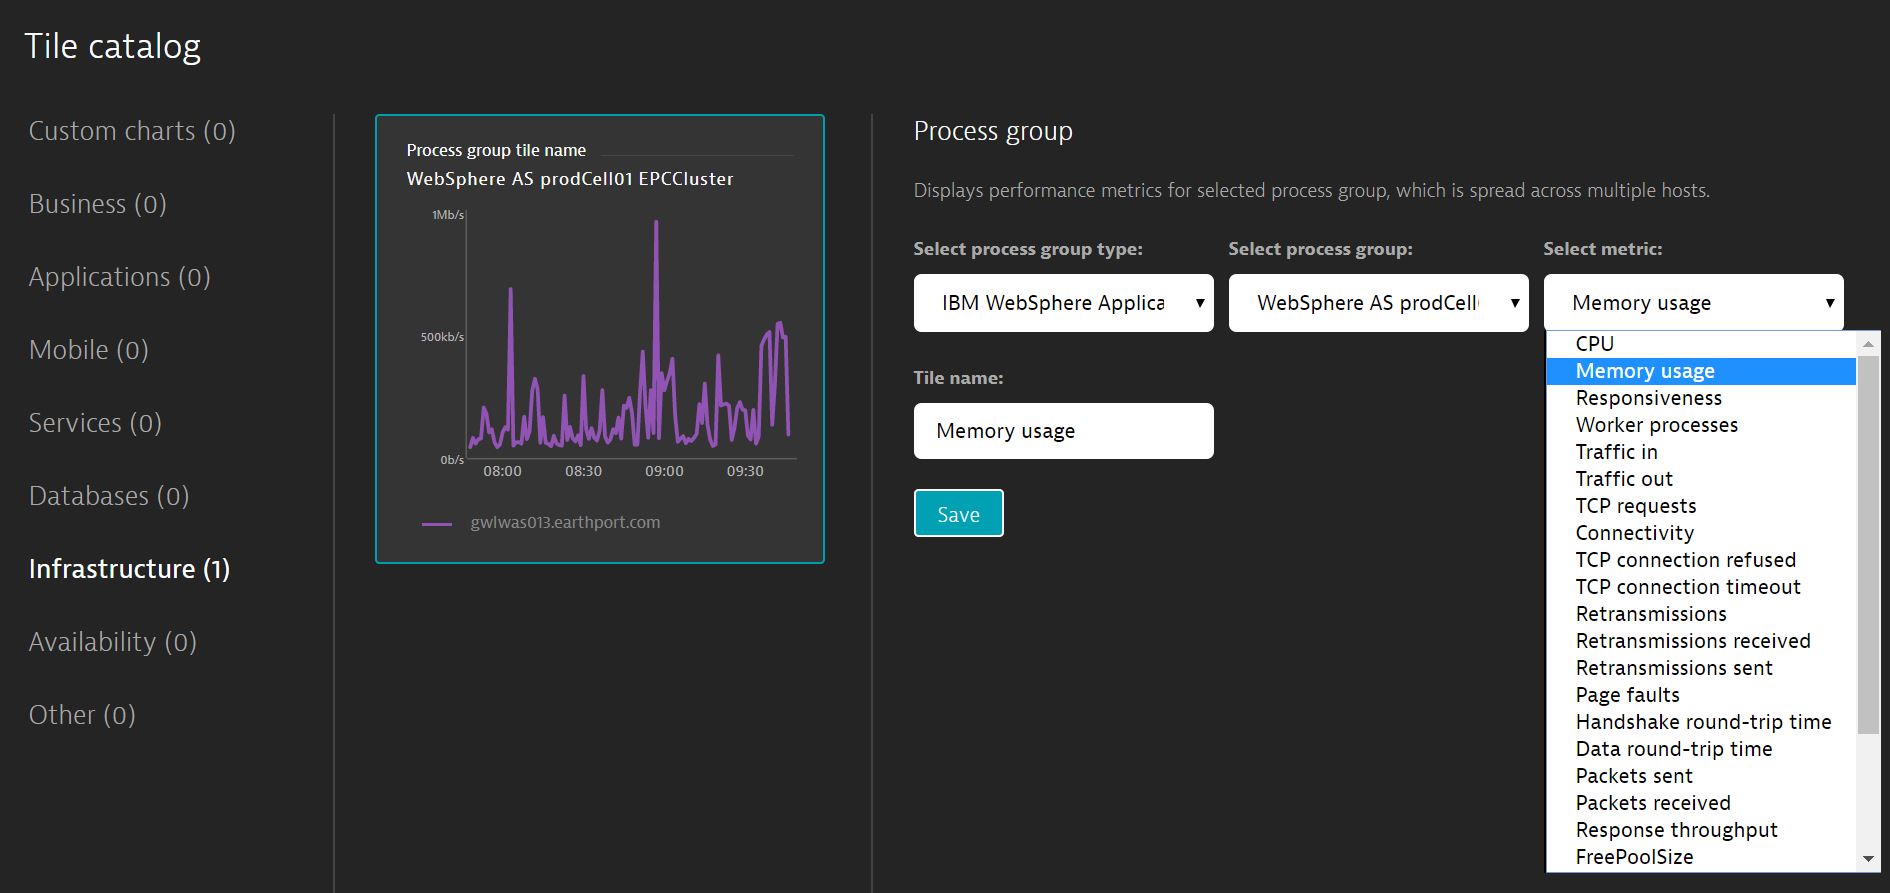
By selecting Add tile > Infrastructure > Process group tile, I have an option for 'Memory usage', but this does not show JVM heap

details.
I would like to display the same metrics I can obtain from drilling down into each process and selecting 'JVM Metrics'. Can this be done?
Additionally, while I am here, where can I find the documentation explaining each individual metric on the drop-down list: Process Group > Select metric?
Many thanks, Cam
Solved! Go to Solution.
- Labels:
-
dashboards classic
-
java
- Mark as New
- Subscribe to RSS Feed
- Permalink
27 Jun 2018
06:11 PM
- last edited on
26 Jan 2022
04:31 PM
by
![]() AgataWlodarczyk
AgataWlodarczyk
Hi,
Yes you can get JVM metrics (committed and used). All you have to do is just scroll down the drop down bar and you can able to see them.
For your question, "I would like to display the same metrics I can obtain from drilling down into each process and selecting 'JVM Metrics'. Can this be done?" - Yes, this can be done. Just choose your process group and select JVM in the drop-down.
You can read about the process group here in the below link,
https://www.dynatrace.com/support/help/infrastruct...
I'll post the exact link if I get one for your request. Hope this helps.
Regards
Muthu
- Mark as New
- Subscribe to RSS Feed
- Permalink
28 Jun 2018 09:45 AM
Hello there Muthu, thank you for your reply. I should have realised, this is a WebSphere feature - it appears the IBM JVM metrics are not supported. I will raise with Dynatrace Support.
Many thanks, Cam
- Mark as New
- Subscribe to RSS Feed
- Permalink
28 Jun 2018 11:18 AM
Thanks, Cam. That makes sense.
Featured Posts
