- Dynatrace Community
- Ask
- Dashboarding
- Re: Monitor the max DB response time of Database
- Subscribe to RSS Feed
- Mark Topic as New
- Mark Topic as Read
- Pin this Topic for Current User
- Printer Friendly Page
- Mark as New
- Subscribe to RSS Feed
- Permalink
17 Feb 2020
09:02 AM
- last edited on
03 Oct 2022
11:06 AM
by
![]() Ana_Kuzmenchuk
Ana_Kuzmenchuk
Hi All,
I want to monitor the max response time of a database and the result should be visualized on a tile within Dashboard. How can I create the custom metric and push it to specific management zones?
So far I think to apply an automatic tagging rule which will put all the database under the same tag "DB ALL". That will allow me to filter the custom chart only for the specific services. Next step is to create the custom metric for the service and pin it as a tile to the dashboard dedicated for DB.
Cheers,
Konstantin
Solved! Go to Solution.
- Mark as New
- Subscribe to RSS Feed
- Permalink
17 Feb 2020 09:07 AM

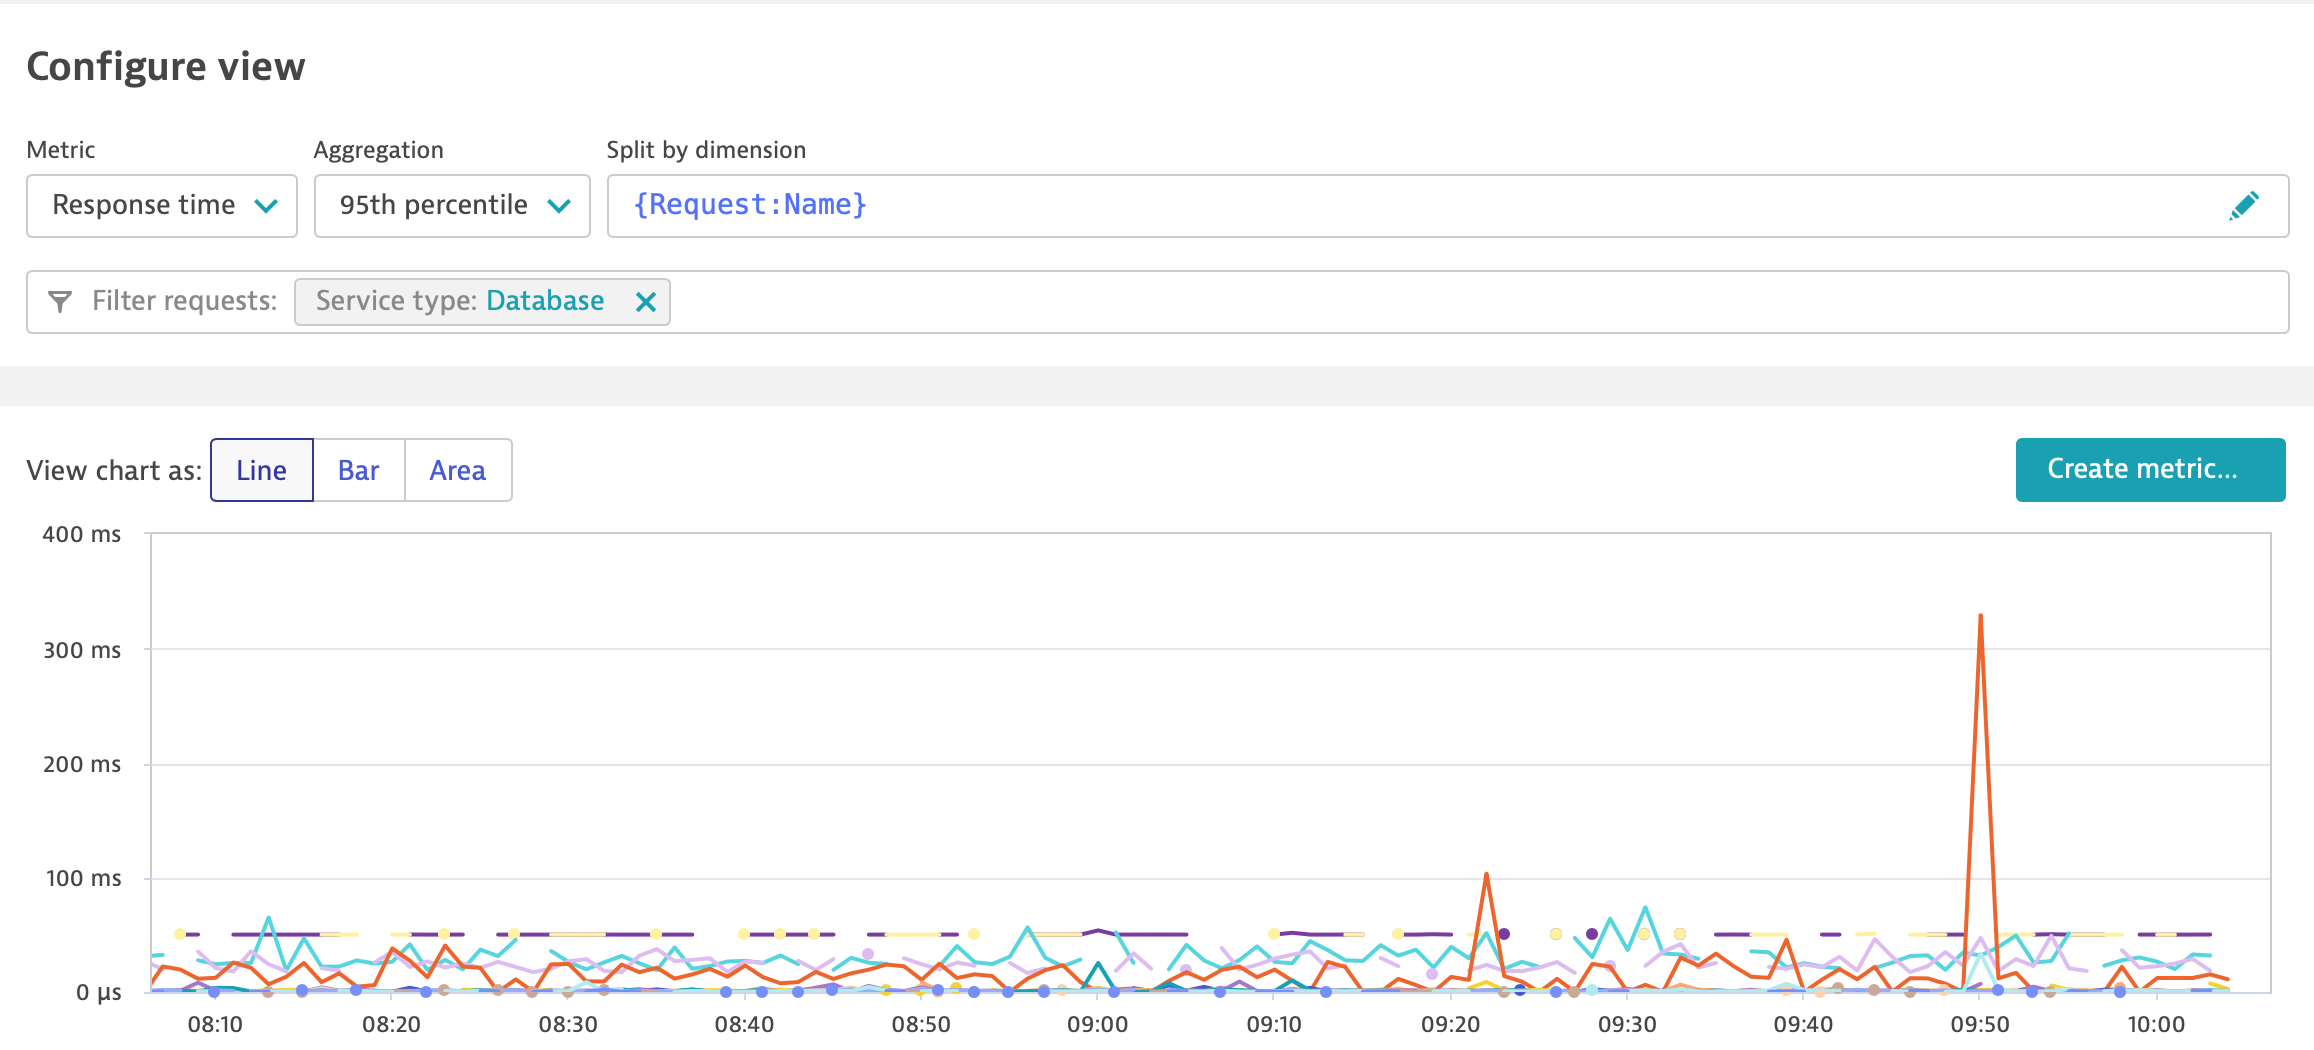
You don't need tag, you can just pick service type, Database, pick 95th percentile agregation to have slowest executions and than you can create metric based on this. Unfortunately there is no 99th percentile or max value.
Sebastian
- Mark as New
- Subscribe to RSS Feed
- Permalink
17 Feb 2020 09:26 AM
Thanks a lot for the hint but how exactly can I create the custom metric?
- Mark as New
- Subscribe to RSS Feed
- Permalink
17 Feb 2020 09:56 AM
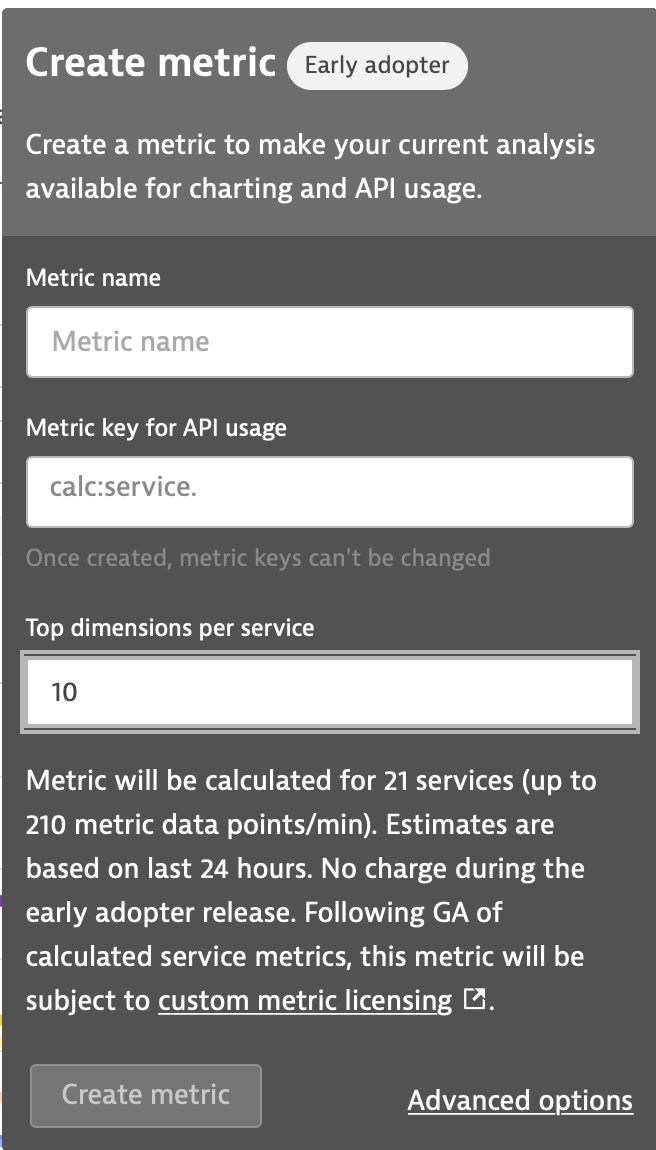
Use button that you can see on screen "Create metric....". After finish the process you will be able to chart it on custom chart. Remember that each DB statement will consume 1 custom metric from license. So if you will have 100 queries, each will be count as new dimension, and each will be consuming license. In such case you will have to use 100 custom metrics from your license.
And my bad, you cannot use percentile and service type as a filter when you are creating metric. You will have to do this via tag or management zone.

you will see there this guy, you will have to pick top X number of statements you wish to monitor. You should be able than to change aggregation on metric itself after creation to see max or percentile.
Sebastian
Featured Posts
