Turn on suggestions
Auto-suggest helps you quickly narrow down your search results by suggesting possible matches as you type.
- Dynatrace Community
- Dynatrace
- Ask
- Dashboarding
- New Data Explorer dashboards
Options
- Subscribe to RSS Feed
- Mark Topic as New
- Mark Topic as Read
- Pin this Topic for Current User
- Printer Friendly Page
Options
- Mark as New
- Subscribe to RSS Feed
- Permalink
11 Aug 2021
06:08 PM
- last edited on
31 May 2023
01:11 PM
by
![]() Michal_Gebacki
Michal_Gebacki
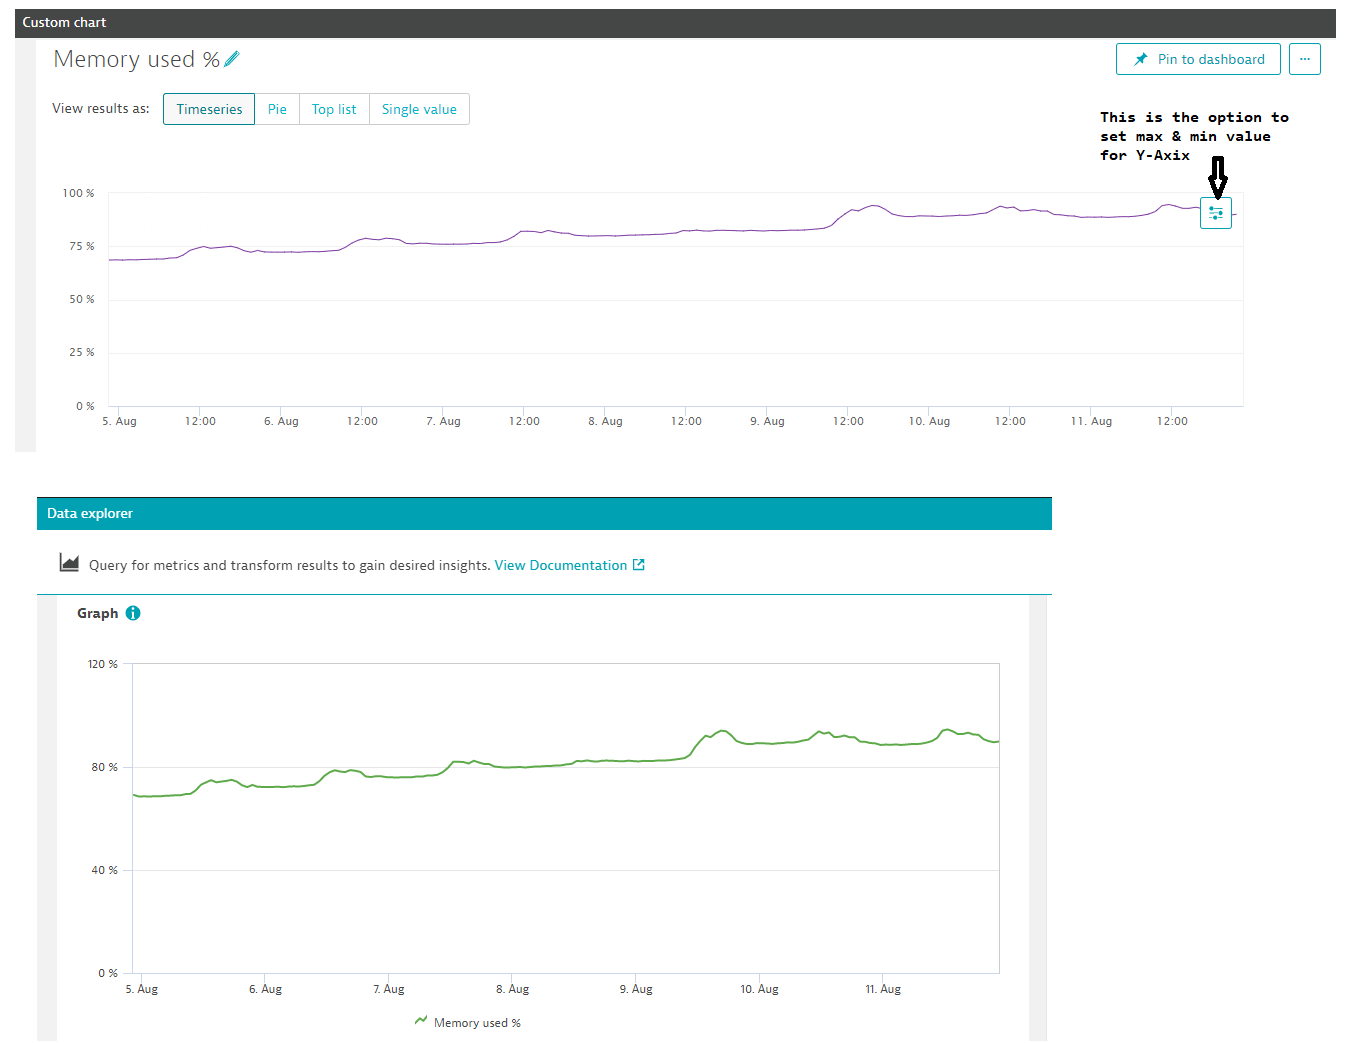
In previous custom charts we can able to set Y-Axis value, but in the new Data Explorer that option is not visible to set the value.
For example, I am plotting a memory usage graph for any particular host then Y-Axis value end with 120% but in custom charts, we can set this value manually like minimum & maximum, so this kind of option is missing or I am not able to find in new Data Explorer.
Please assist me, to find this option in the Data explorer charts.
I have attached a screenshot also for reference

Regards
Sagar Dalvi
Solved! Go to Solution.
Labels:
- Labels:
-
dashboards classic
-
data explorer
dataexplorer.png
41 KB
Reply
3 REPLIES 3
Options
- Mark as New
- Subscribe to RSS Feed
- Permalink
11 Aug 2021 06:35 PM
Hello,
Unfortunately this feature is not available for Data Explorer charts. However, the Dev team is working on this functionality - there is currently not an exact date as to when it will be complete though.
-Ryan
ACE Consultant, Dynatrace Services
Dynatrace Certified Professional
Dynatrace Certified Professional
Reply
Options
- Mark as New
- Subscribe to RSS Feed
- Permalink
11 Aug 2021 08:08 PM
This and other issues regarding the Custom Charts -> Data Explorer transition are also being discussed here:
Antonio Sousa
Reply
Options
- Mark as New
- Subscribe to RSS Feed
- Permalink
12 Aug 2021 03:05 PM - edited 12 Aug 2021 03:05 PM
Hi, @sagar_dalvi !
Currently, this is not possible using Data Explorer!
@AntonioSousa and I have compiled a whole list of features supported on Custom Charts, but still missing on Data Explorer: this is one of them!
You can find it on: https://community.dynatrace.com/t5/Dynatrace-product-ideas/PLEASE-PLEASE-don-t-take-away-Custom-Char...
You can check the rest on that thread, including comments on migrating from one solution to the other!
If you have any additional insight on this matter (like, other missing features that is not yet on the list), feel free to comment there!
Best regards, Pedro Deodato
Reply
