This website uses Cookies. Click Accept to agree to our website's cookie use as described in our Privacy Policy. Click Preferences to customize your cookie settings.
Dashboarding
Dynatrace dashboards, notebooks, and data explorer explained.
Turn on suggestions
Auto-suggest helps you quickly narrow down your search results by suggesting possible matches as you type.
- Community Home
- Platform
- Dashboarding
- Red in Service Health Dashlet in Dynatrace
Options
- Subscribe to RSS Feed
- Mark Topic as New
- Mark Topic as Read
- Pin this Topic for Current User
- Printer Friendly Page
Options
- Mark as New
- Subscribe to RSS Feed
- Permalink
21 Feb 2020 02:27 PM
10 REPLIES 10
Options
- Mark as New
- Subscribe to RSS Feed
- Permalink
21 Feb 2020 02:31 PM
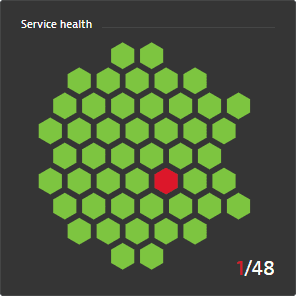
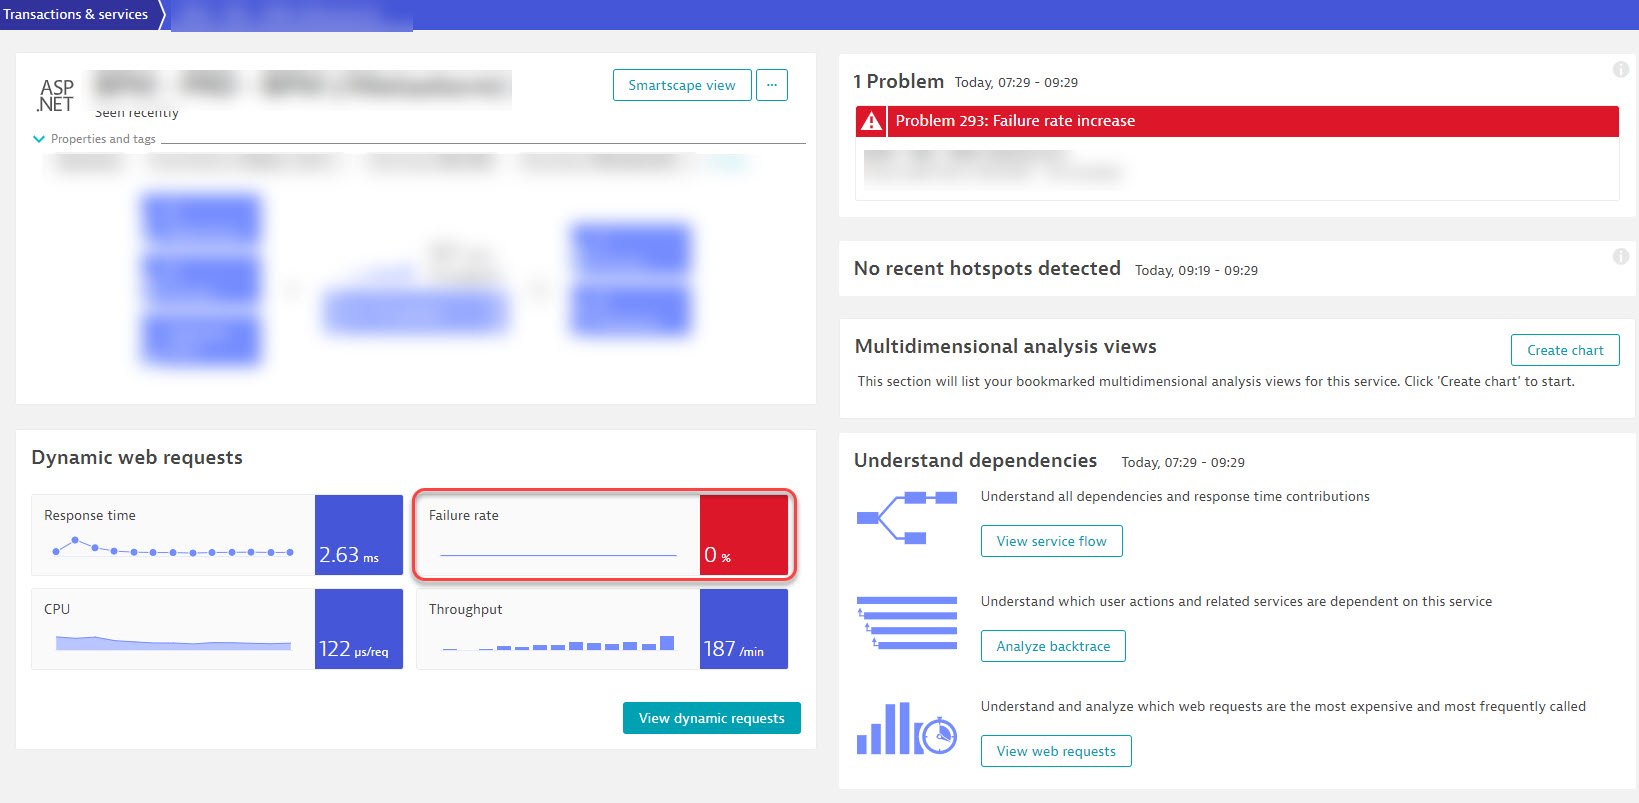
@Yuting W. Services will turn red if there are errors/failures, slowdowns, increase in CPU usage, etc... All of this is analyzed and processed by Dynatrace's AI engine Davis and a problem alert is generated.

-Chad
service-failure.jpg
212 KB
Reply
Options
- Mark as New
- Subscribe to RSS Feed
- Permalink
21 Feb 2020 05:44 PM
So if a service becomes unavailable, it won't appear there as red but will disappear in the graph right?
Options
- Mark as New
- Subscribe to RSS Feed
- Permalink
21 Feb 2020 06:01 PM
exactly correct, you can adjust this by changing that setting.
-Chad
Options
- Mark as New
- Subscribe to RSS Feed
- Permalink
21 Feb 2020 06:06 PM
Where can I change the setting?
Options
- Mark as New
- Subscribe to RSS Feed
- Permalink
21 Feb 2020 06:42 PM
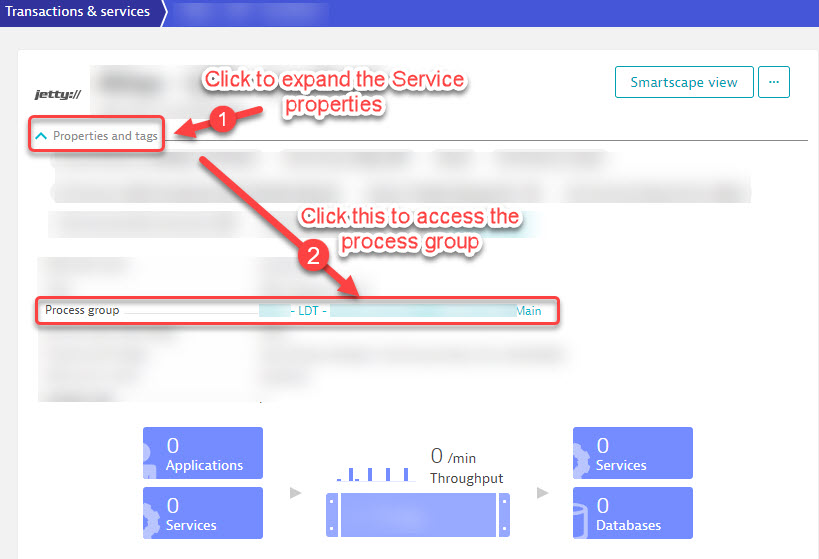
In order to change this setting we need to navigate back to the process group that contains this service. To do this from the service level, we will need to do the following:
Navigate to the service in question and access the process group that contains the service:
Once the process group is accessed, edit the settings:
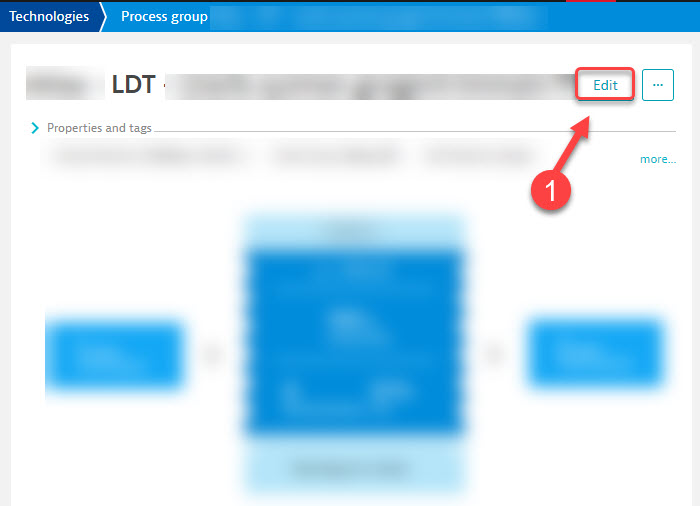
Then set the anomaly detection to the following:
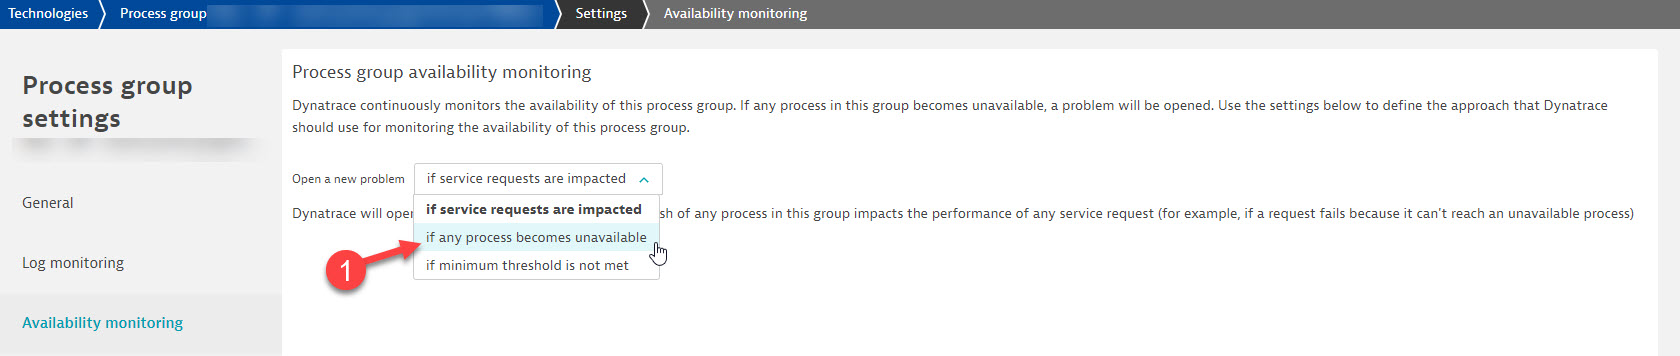
-Chad
Options
- Mark as New
- Subscribe to RSS Feed
- Permalink
21 Feb 2020 06:45 PM
I know this settings. Thanks anyways. I meant - how do we see a red hexagon if a service is unavailable in that "Service Health" Dashlet?
Options
- Mark as New
- Subscribe to RSS Feed
- Permalink
21 Feb 2020 06:48 PM
If you make the changes as shown, it will detect the service as an outage and will mark it as red within your honeycomb/hexagonal tile 🙂 It can get confusing sometimes lol
-Chad
Options
- Mark as New
- Subscribe to RSS Feed
- Permalink
21 Feb 2020 06:51 PM
No...in my dashboard even tho i made the changes you've shown above, when a service becomes unavailable, it will disappear from the dashlet instead of turning it to red.
Options
- Mark as New
- Subscribe to RSS Feed
- Permalink
21 Feb 2020 06:52 PM
interesting ....
-Chad
Options
- Mark as New
- Subscribe to RSS Feed
- Permalink
21 Feb 2020 06:12 PM
Hi, @Yuting W. Thanks for the question!
If you want to know more about dashboards, you can take part in our Shared Dashboard Challenge to get a chance to win a 30 min "Ask Me anything" session with the Technical Product Manager responsible for Dashboards - Roman Windischhofer and get all your questions answered right away! 🙂
Featured Posts
