This website uses Cookies. Click Accept to agree to our website's cookie use as described in our Privacy Policy. Click Preferences to customize your cookie settings.
Dashboarding
Dynatrace dashboards, notebooks, and data explorer explained.
Turn on suggestions
Auto-suggest helps you quickly narrow down your search results by suggesting possible matches as you type.
- Community Home
- Platform
- Dashboarding
- Re: Response time degradation problem did not occur as we expected
Options
- Subscribe to RSS Feed
- Mark Topic as New
- Mark Topic as Read
- Pin this Topic for Current User
- Printer Friendly Page
Options
- Mark as New
- Subscribe to RSS Feed
- Permalink
15 Feb 2019
12:34 PM
- last edited on
10 May 2021
01:58 PM
by
![]() MaciejNeumann
MaciejNeumann
Hi!
We experienced over 10 seconds response time of a certain service on Feb 8th but Dynatrace did not detect it.
We could not find red zone on this graph.
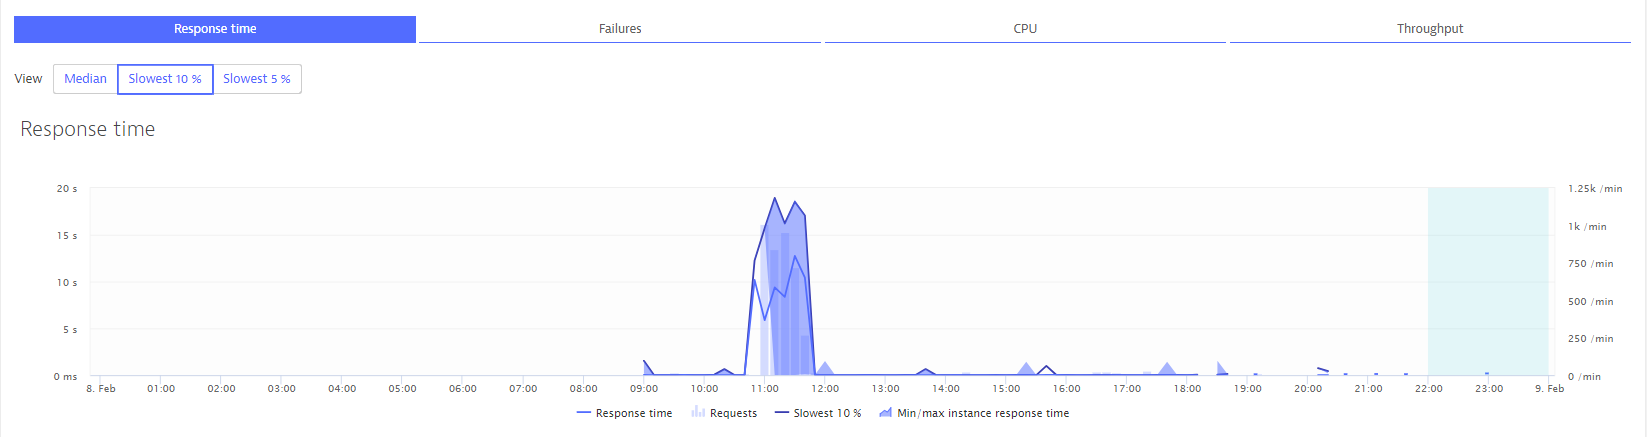
There is no problem on this service detail page.

I confirmed the following 2 points but I am not sure why Response time degradation problem did not occur as we expected.
- I referred this document and found the description "Applications and services have to run for at least 20% of a week before slowdown and error rate alerts are raised"
https://www.dynatrace.com/support/help/monitor/pro...
However, I calculated the run ration and the result is over 20 %. - I referred Settings > Anomaly detection > Services and found an option "To avoid over-alerting do not alert for low load services with less than 10 requests/min."
However, I calculate the average value of requests to this service during 7 days before Feb 8th, then the result is over 10 requests/min.
Please see the result of calculation theresultofcalculation.xlsx
Do you think what I confirmed is beside the point?
Could you please let me know the other point I should confirm in order to enable Dynatrace to detect response degradation of this service?
Best Regards,
Natsumi Tanaka
Solved! Go to Solution.
Labels:
- Labels:
-
services classic
4 REPLIES 4
Options
- Mark as New
- Subscribe to RSS Feed
- Permalink
15 Feb 2019 12:42 PM
Hi Natsumi,
you mentioned the point of "Applications and services have to run for at least 20% of a week before slowdown and error rate alerts are raised" and said that you calculated the runtime to be higher than that.
This service seems to have had it's first request at 9am though and the increase in response time started at 11am. That's only 2 hours and therefore less than 20% of a week. Am I missing something here?
best regards
Franz
Options
- Mark as New
- Subscribe to RSS Feed
- Permalink
15 Feb 2019 12:51 PM
Hi Franz,
Thank you for your reply!
The document says 20% of a week, so I calculated the requests from Feb 1 to Feb 7.
Please see this graph.
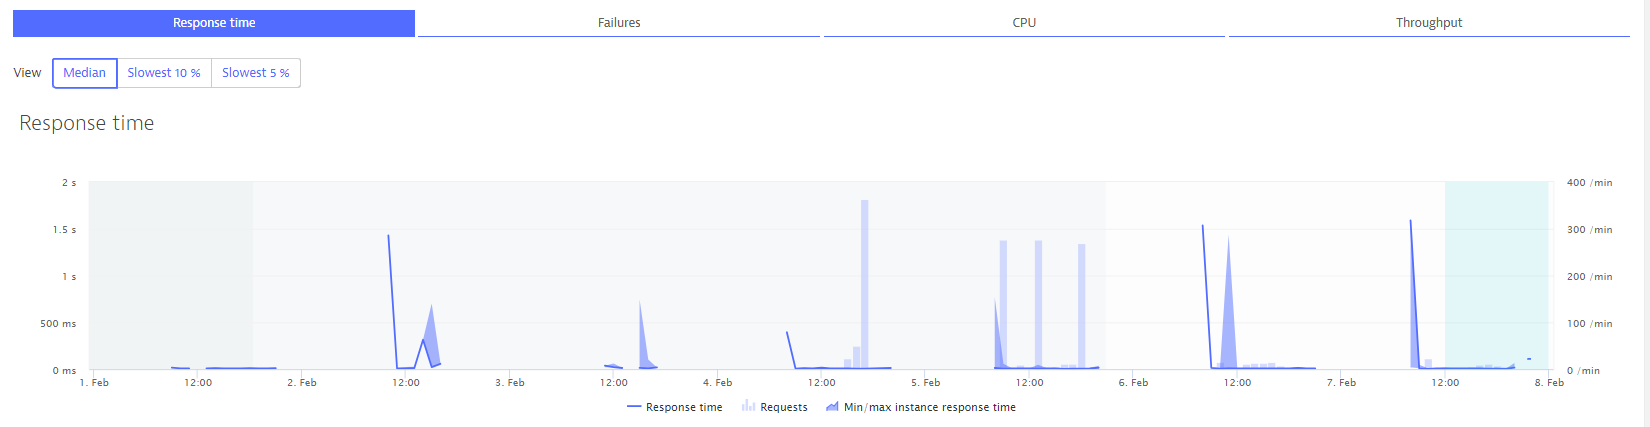
This graph also shows the run time is higher than 20%.
Options
- Mark as New
- Subscribe to RSS Feed
- Permalink
15 Feb 2019 02:00 PM
The running time has to be more than 20% of 7 days and you need at least around 10 requests per minute load. If you would like to have a strict alert for low load infrequent running services you can set a static threshold. See help topic here:
https://www.dynatrace.com/support/help/monitor/problems/problem-detection/how-are-new-problems-evaluated-and-raised/
Options
- Mark as New
- Subscribe to RSS Feed
- Permalink
19 Feb 2019 01:53 PM
Hi Wolfgang,
Thank you for your comment,
I will read the document you mentioned.
Featured Posts
