This website uses Cookies. Click Accept to agree to our website's cookie use as described in our Privacy Policy. Click Preferences to customize your cookie settings.
Dashboarding
Dynatrace dashboards, notebooks, and data explorer explained.
Turn on suggestions
Auto-suggest helps you quickly narrow down your search results by suggesting possible matches as you type.
- Community Home
- Platform
- Dashboarding
- Re: USQL - group by action duration
Options
- Subscribe to RSS Feed
- Mark Topic as New
- Mark Topic as Read
- Pin this Topic for Current User
- Printer Friendly Page
Options
- Mark as New
- Subscribe to RSS Feed
- Permalink
29 Jun 2019
06:43 AM
- last edited on
31 Aug 2022
11:03 AM
by
![]() MaciejNeumann
MaciejNeumann
Hello, I’m curious if it is possible to get such chart from USQL:
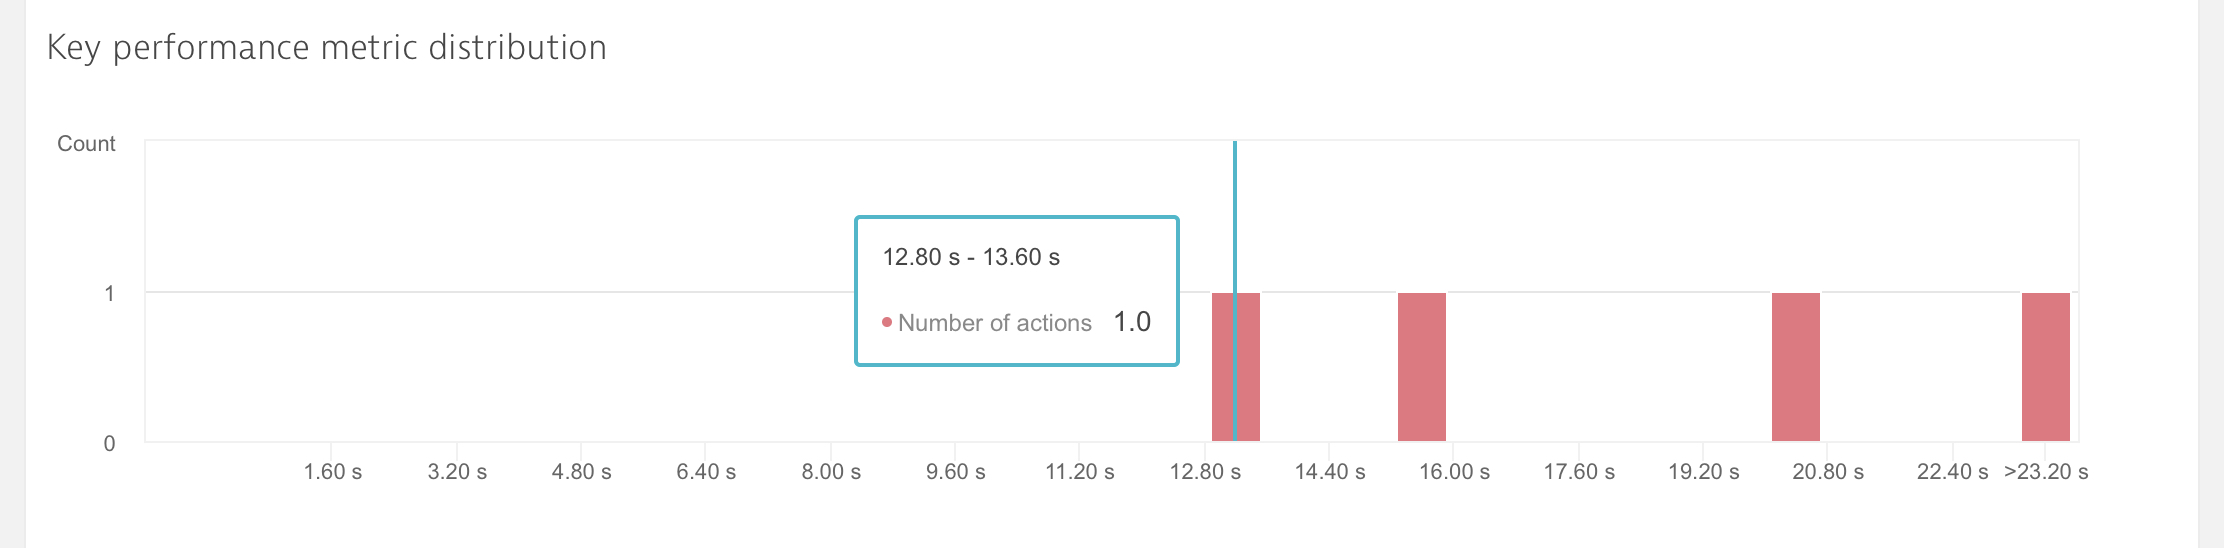
I was trying multiple ways but I think it is not possible. But maybe someone has idea how to get action duration distribution for particular user action? 🙂
Sebastian
Regards, Sebastian
Solved! Go to Solution.
Labels:
- Labels:
-
data explorer
-
user sessions
-
usql
2 REPLIES 2
Options
- Mark as New
- Subscribe to RSS Feed
- Permalink
01 Jul 2019 08:46 AM
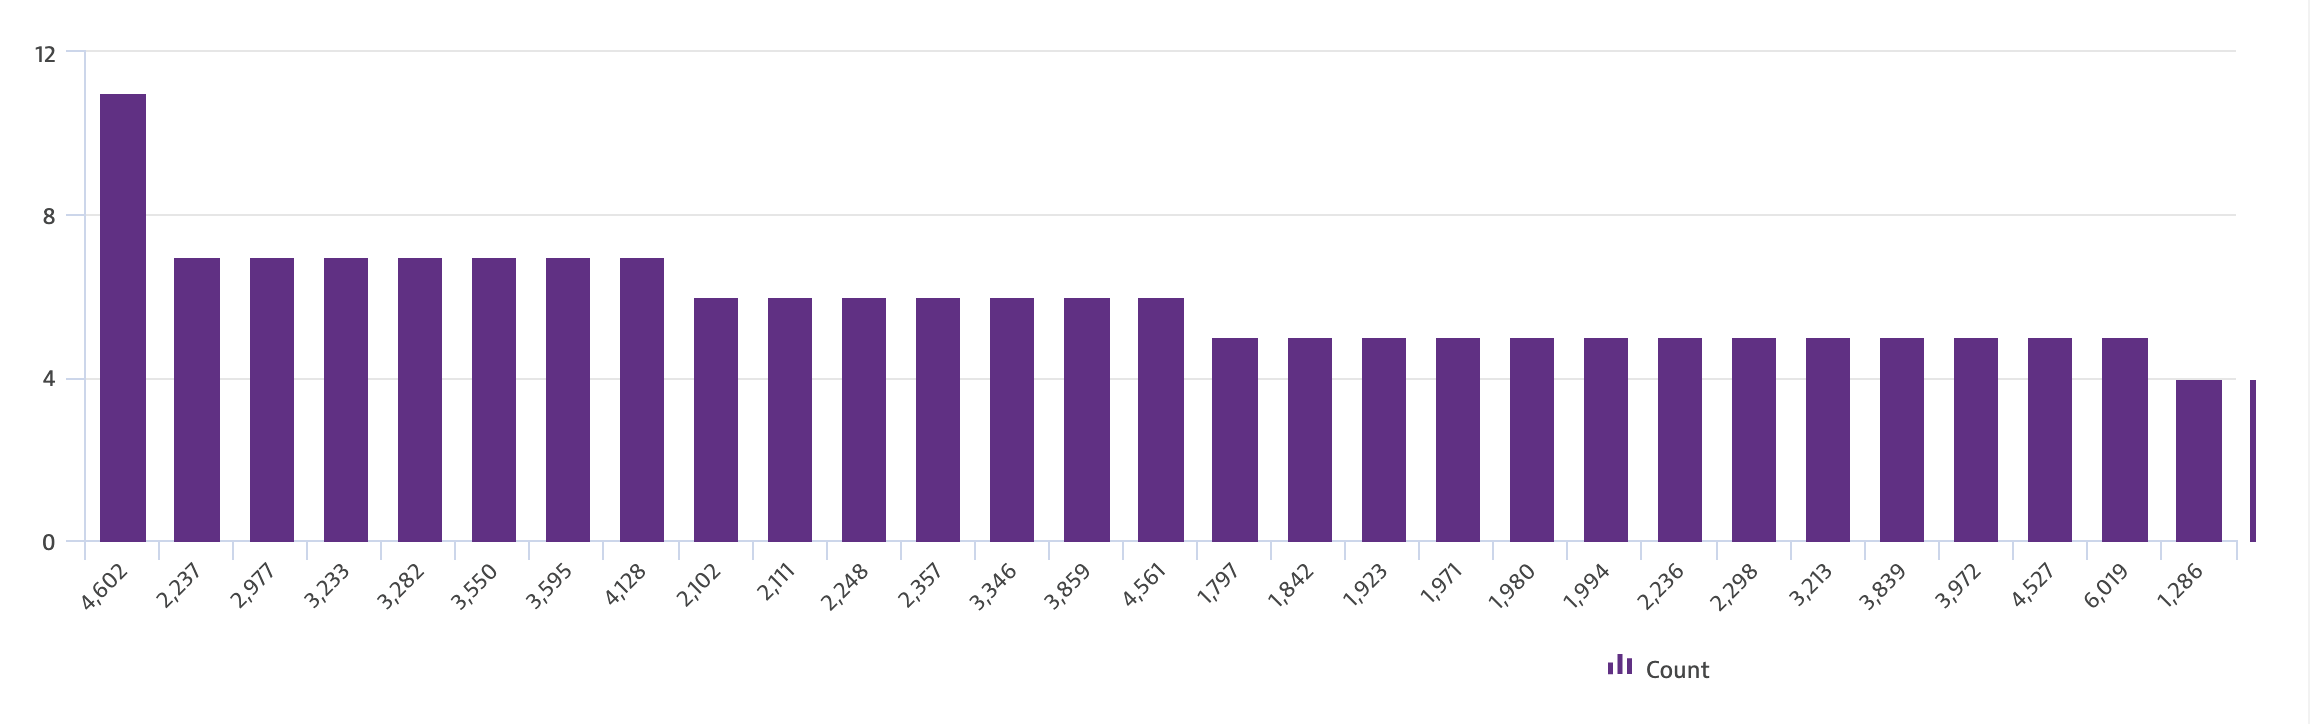
Ok there is such option:
SELECT MEDIAN(duration) as "Duration (ms)", COUNT(*) as "Count" FROM useraction WHERE useraction.name IN ('Loading of page /') AND usersession.userType IS "REAL_USER" GROUP BY duration ORDER BY duration ASCHere is example. Result looks like this:
It would be great if there will be option for defining steps manually. But this is fine as well 🙂
Sebastian
Regards, Sebastian
Reply
Options
- Mark as New
- Subscribe to RSS Feed
- Permalink
01 Jul 2019 11:34 AM
Thank you, this result is very interesting. In AppMon i creating three business transaction (fast, slow, very slow) and then put them on one chart.
With this USQL query we can get response time distribution in several clicks on dashboard.
Maybe later we will have these futures:
casewhen
And then it will possible to create ranges (fast, slow, very slow) and display result on dashboard.
Regards,
Alexander
Reply
Featured Posts
