- Dynatrace Community
- Dynatrace
- Ask
- Dashboarding
- Which aggregation used on widgets service&key-request
- Subscribe to RSS Feed
- Mark Topic as New
- Mark Topic as Read
- Pin this Topic for Current User
- Printer Friendly Page
- Mark as New
- Subscribe to RSS Feed
- Permalink
06 Apr 2021 10:32 AM
Hello
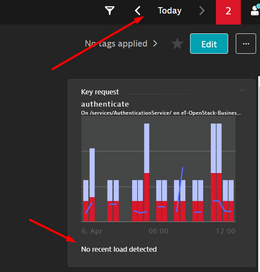
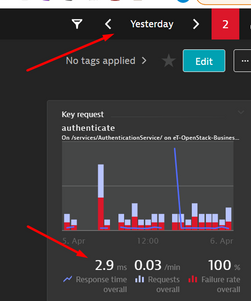
I do not properly understand which aggregation used for response time, load on widgets service key-request?
For example
I expect to see the metrics values for the selected interval - but I don't see anything
Why ?
but for example, for the interval yesterday, the widget already shows values
for me it is not transparent how it works.
I did not find a description in the documentation on this issue
Solved! Go to Solution.
- Labels:
-
dashboards classic
- Mark as New
- Subscribe to RSS Feed
- Permalink
06 Apr 2021 10:55 AM
I understand the type of metrics, I am asking about aggregation and why the widget does not show values
Thanks!
- Mark as New
- Subscribe to RSS Feed
- Permalink
12 Apr 2021 02:35 PM
I understood.
The latest versions of the solution added tips
- Current - shows the aggregated value for the last monitoring interval
- Overall - shows the aggregated value for the selected interval

I had an older version installed where these marks were not, so it was not obvious what value on the chart


