- Dynatrace Community
- Ask
- Dynatrace API
- Re: Feasibility check > data explorer > code approach: add dimension {URL:Host} {Request:Name} ?
- Subscribe to RSS Feed
- Mark Topic as New
- Mark Topic as Read
- Pin this Topic for Current User
- Printer Friendly Page
- Mark as New
- Subscribe to RSS Feed
- Permalink
19 Jan 2023
11:31 PM
- last edited on
25 Jan 2023
08:43 AM
by
![]() MaciejNeumann
MaciejNeumann
Our goal is to use "data explorer" coding approach to display multi-dimensional report without using custom metrics.
Use case:
#0. This code working in data explorer:
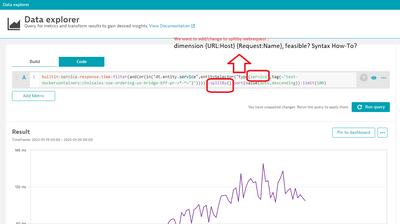
builtin:service.response.time:filter(and(or(in("dt.entity.service",entitySelector("type(service),tag(~"test-dockercontainers:chnlsales-soe-ordering-ux-bridge-bff-pr-v*-*~")"))))):splitBy():sort(value(auto,descending)):limit(100)
#1. Now we want to change type(service) to type(webrequest???) instead, so that we can get the statistics by dimension {URL:Host} {Request:Name}, then pin the report to dashboard.
Below syntax failed, what should be the correct one? is it feasible? Please note we TRY TO AVOID setup custom metrics which will cost us many extra DDU license charge.
builtin:service.response.time:filter(and(or(in("dt.entity.service",entitySelector("type(webrequest???),tag(~"test-dockercontainers:chnlsales-soe-ordering-ux-bridge-bff-pr-v*-*~")"))))):splitBy():sort(value(auto,descending)):limit(100)
Demo screenshots:
Figure1 > Goal to get result like below: Split by dimension
Figure2 > we want to use "data explorer" coding approach to get results in Figure1
Solved! Go to Solution.
- Mark as New
- Subscribe to RSS Feed
- Permalink
20 Jan 2023 07:28 AM
I recommend using Key Requests in your case which are designed for your purpose - charting metrics about particular requests.
The main differentiator many users are not aware of is that the MDA works with service request data (raw captured trace data) while Data Explorer works with metrics. Both serve different purposes.
Featured Posts


