- Dynatrace Community
- Ask
- Dynatrace Managed Q&A
- Open Discussion - Interpret trace
- Subscribe to RSS Feed
- Mark Topic as New
- Mark Topic as Read
- Pin this Topic for Current User
- Printer Friendly Page
- Mark as New
- Subscribe to RSS Feed
- Permalink
21 Feb 2024 06:04 AM
Hello All,
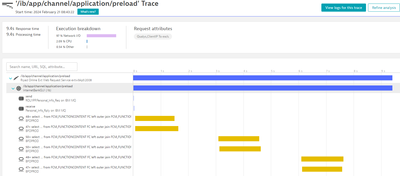
how would you interpret the bellow trace,
Bellow Queries are taking 1.5sec each,
after checking with database team, same queries are taking around 40msec.
Why its network I/O? is it because we are monitoring the calls from application server, so network time and processing are also counted?
Thanks.
Solved! Go to Solution.
- Labels:
-
distributed traces classic
- Mark as New
- Subscribe to RSS Feed
- Permalink
21 Feb 2024 06:34 AM
Hi @Malaik
You mentioned that the same queries are taking 40ms. One query or 47/50 queries are taking 40ms? If one and you multiply 47 or 50 times then it could be 1,5 - 2 sec (1500ms - 2000ms).
Best regards,
Mizső
- Mark as New
- Subscribe to RSS Feed
- Permalink
21 Feb 2024 07:36 AM
you have around 300 db calls in this trace.
2 additional ms per db call means 0.6 seconds.
- Mark as New
- Subscribe to RSS Feed
- Permalink
21 Feb 2024 11:06 AM
In the case of such a number of queries, I would be interested to know whether you have correctly set the cache for database queries on the application side (a very common problem on environments with Hibernate).
Featured Posts


