- Dynatrace Community
- Dynatrace
- Ask
- Open Q&A
- Re: Custom events for alerting from OpenTelemetry
- Subscribe to RSS Feed
- Mark Topic as New
- Mark Topic as Read
- Pin this Topic for Current User
- Printer Friendly Page
- Mark as New
- Subscribe to RSS Feed
- Permalink
07 Jun 2022 01:42 PM
Hello,
I would like to know if there is a possibility to use from OpenTelemetry traces>ConfigurationData.find>Timing section to create Custom events for alerting.
Solved! Go to Solution.
- Labels:
-
alerting
-
anomaly detection
-
opentelemetry
- Mark as New
- Subscribe to RSS Feed
- Permalink
07 Jun 2022 08:50 PM
Hi, sp
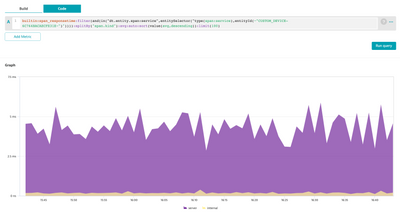
Try to use the builtin:span_responsetime metric, and split the dimension by span.kind, filtering by the resulting span service from your ingestion.
Check if this fit for your need.
- Mark as New
- Subscribe to RSS Feed
- Permalink
07 Jun 2022 09:54 PM
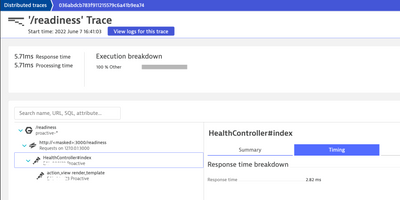
Hi, in code for metric, you have spin.kind. And in the first screen health controller index. This means that you set span kind for health controller index? I cannot relate both screens together. However very insightful for me at first place.
- Mark as New
- Subscribe to RSS Feed
- Permalink
07 Jun 2022 10:12 PM
HealthController#index is the trace name, indeed you will not be able to use it as a filter for the metric monitoring, but you can monitor the span service where this trace is associated with, and then, the monitoring will be done on all the traces.
- Mark as New
- Subscribe to RSS Feed
- Permalink
07 Jun 2022 10:21 PM - edited 08 Jun 2022 01:49 PM
I wrote the following but got no response:
builtin:span_responsetime:filter(and(in("dt.entity.span:service",entitySelector("type(span:service),entityId(~"SERVICE-A0248DA9AF8D0000~")")))):splitBy("span.kind"):avg:auto:sort(value(avg,descending)):limit(100)
I assume from my span: kind is by me "client". And Operation is "ConfigurationData.find", (where this appears by me as "HealthController#index" in your case) .
And by my app, only trace from OpenTelemetry is integrated and nothing more. If other steps should be done to get back entries from this query?
Plus: pure "builtin:span_responsetime" does not work, as well, any idea, what could be the reason?
- Mark as New
- Subscribe to RSS Feed
- Permalink
08 Jun 2022 04:04 PM
How are you instrumenting the OpenTelemetry to get the ingested traces?
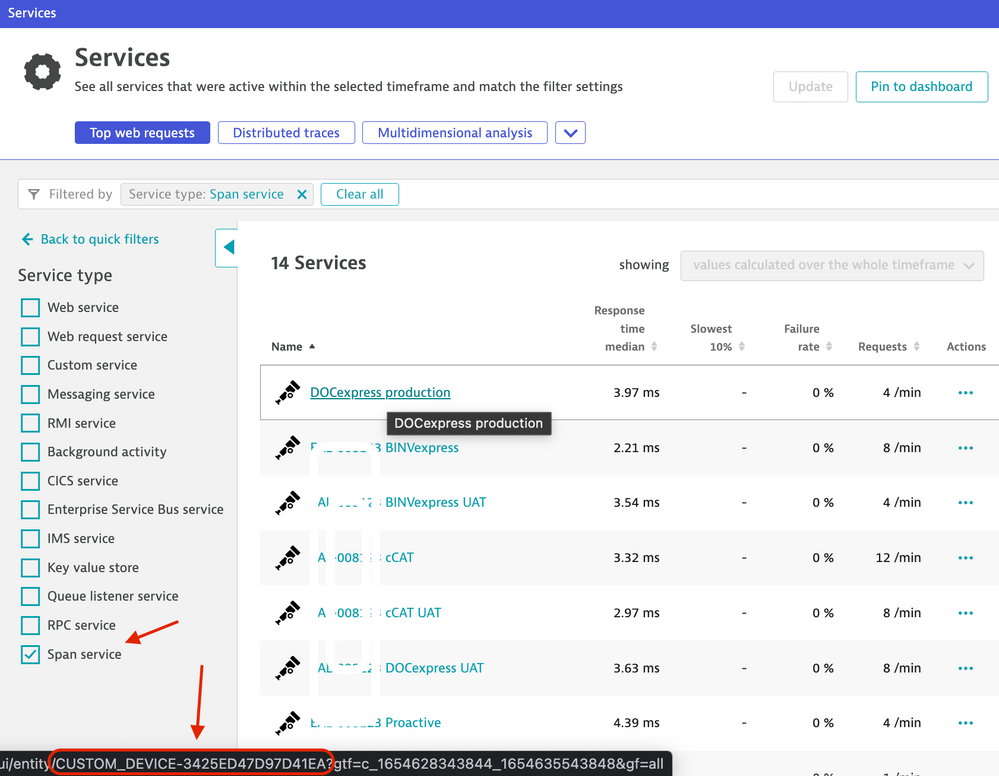
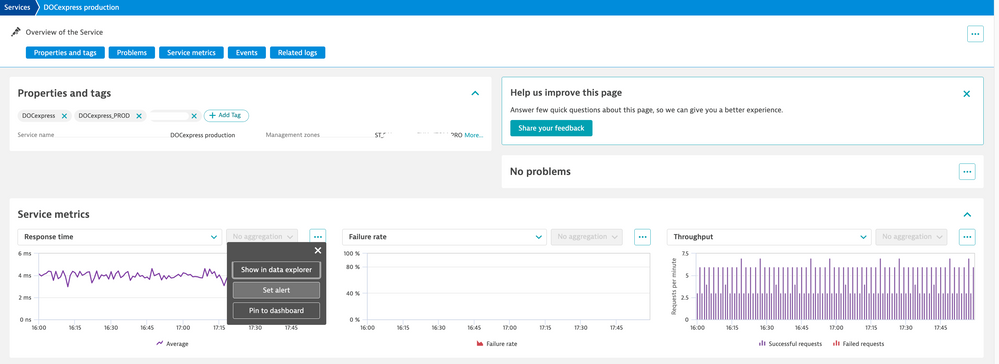
If you are using the OT instrumentation, you should see a service span type on your service list... but if you look closer, they are not services, but Custom devices.
This was added to the SaaS version 1.238, https://www.dynatrace.com/support/help/shortlink/release-notes-saas-sprint-238#services-for-opentele...
not sure about Managed (found nothing on release notes)
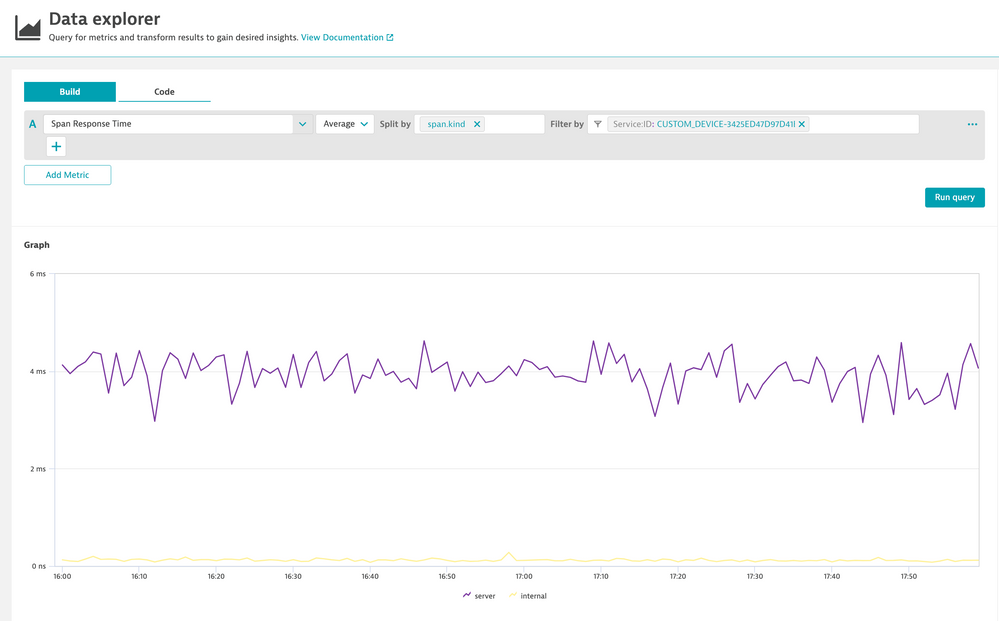
So, if you are seeing those span services on your env, I suggest to try the Explore Data on Build mode, instead code, to make things easy.
Or do this, to make even easier:
- Mark as New
- Subscribe to RSS Feed
- Permalink
08 Jun 2022 04:23 PM
https://opentelemetry.io/docs/instrumentation/go/getting-started/#trace-instrumentation
applied this approach here. Instrumenting trace. and under services don't have span service in UI..
- Mark as New
- Subscribe to RSS Feed
- Permalink
08 Jun 2022 05:29 PM
What is the version of your Dynatrace tenant? Is it SaaS or Managed?
- Mark as New
- Subscribe to RSS Feed
- Permalink
09 Jun 2022 12:49 PM
1.236.119.20220321-160129 and is managed
- Mark as New
- Subscribe to RSS Feed
- Permalink
09 Jun 2022 08:50 PM
The span services were introduced on version 1.238 (SaaS), not sure about Managed.
You can try to update the version to get it automatically or define your own manually.
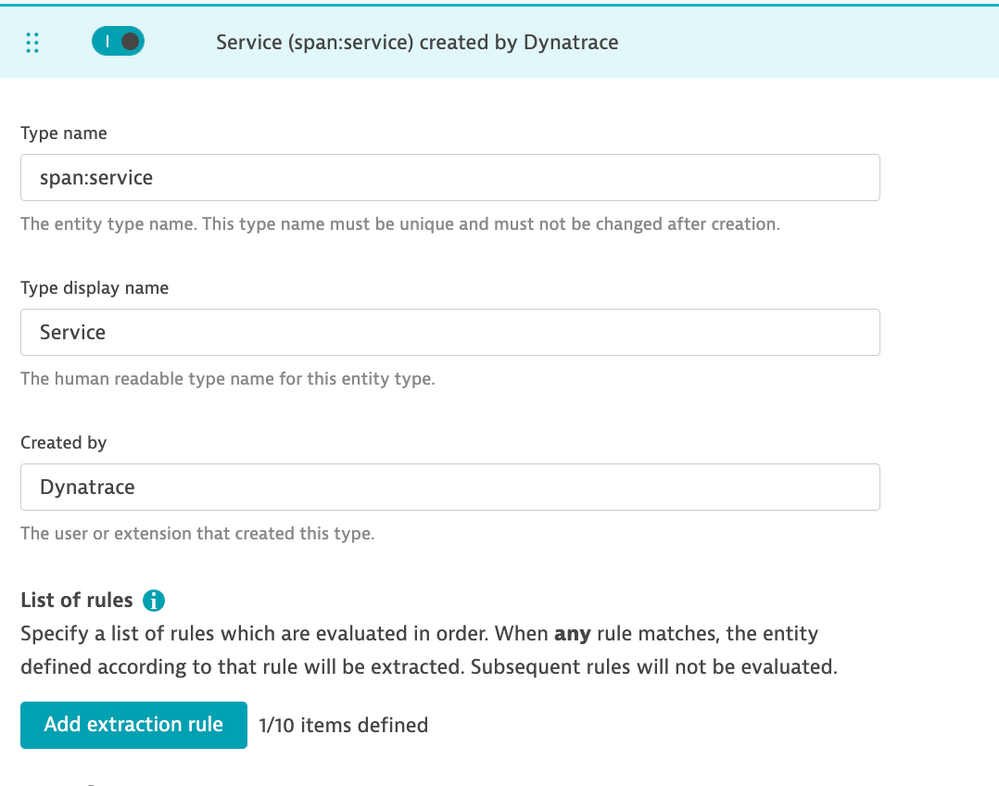
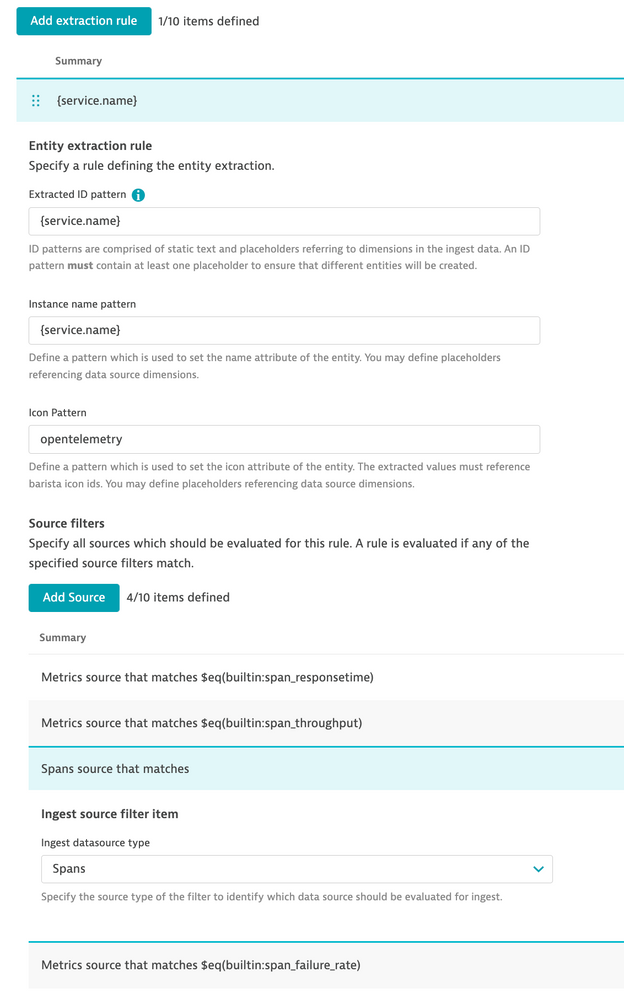
https://www.dynatrace.com/support/help/shortlink/custom-topology#define-new-entity-type
Here are the rules for the span services that is created since 1.238 version:
