- Dynatrace Community
- Dynatrace
- Ask
- Open Q&A
- Databases Menu item - metrics split across connection strings
- Subscribe to RSS Feed
- Mark Topic as New
- Mark Topic as Read
- Pin this Topic for Current User
- Printer Friendly Page
Databases Menu item - metrics split across connection strings
- Mark as New
- Subscribe to RSS Feed
- Permalink
29 Mar 2022
09:01 PM
- last edited on
30 Mar 2022
12:40 PM
by
![]() MaciejNeumann
MaciejNeumann
We've had this question since day 1 but thought I'd get some community feedback on it.
In my organization there are some central database that many departments connect to. They can use all different types of connection strings to access this database. We're trying to use Dynatrace's Database monitor though to get a overarching view regarding the database's performance.
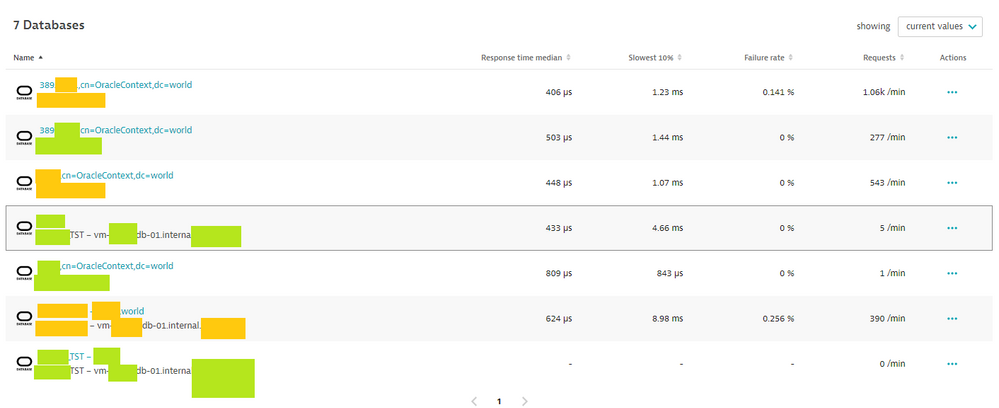
Problem is, you can't do that. Dynatrace splits up the metrics based on the connection string used.
In this image, Dynatrace reports 7 databases under say the name "CoolDB" for which there is a a CoolDB_PRD (Green) and a CoolDB_TST (Orange). But users connect to each with different connection strings. Thus what is really 2 database, Dynatrace presents as 7.
For us to understand all the things the Production Database is doing I have to go into 4 different entities in Dynatrace. This is really counter-productive to monitoring our Production database.
I can't go out and tell all the developers to use the same connection string, that's just not something you can do in our environment.
Any thoughts on how to better configure Dynatrace so i can get a better single pane of glass on this?
- Mark as New
- Subscribe to RSS Feed
- Permalink
29 Mar 2022 10:11 PM
I'm hoping that this recent post of mine,
https://community.dynatrace.com/t5/Dynatrace-Open-Q-A/Group-Oracle-database-processes-by-SID/m-p/183...
might help here, but have got no replies yet... If you are able to try, it might help 😉

