Turn on suggestions
Auto-suggest helps you quickly narrow down your search results by suggesting possible matches as you type.
- Dynatrace Community
- Dynatrace
- Ask
- Open Q&A
- Dynatrace Detected JAXBMessage Blocking
Options
- Subscribe to RSS Feed
- Mark Topic as New
- Mark Topic as Read
- Pin this Topic for Current User
- Printer Friendly Page
Options
- Mark as New
- Subscribe to RSS Feed
- Permalink
09 Sep 2021
04:53 AM
- last edited on
18 Nov 2021
11:28 AM
by
![]() MaciejNeumann
MaciejNeumann
Dear Sir/Madam,
Customer has a JAX-WS SOAP-Based web service class called AppService serving many of the operation with their mobile app. There are not much internal/custom packages written and imported in this AppService class; most of the operations are with standard JDK libraries, JWS and Apache HTTP client only. Generally, the underlying operations are the mobile app send XHR requests to this AppService and the service return required values in SOAP message through different web methods (web services).
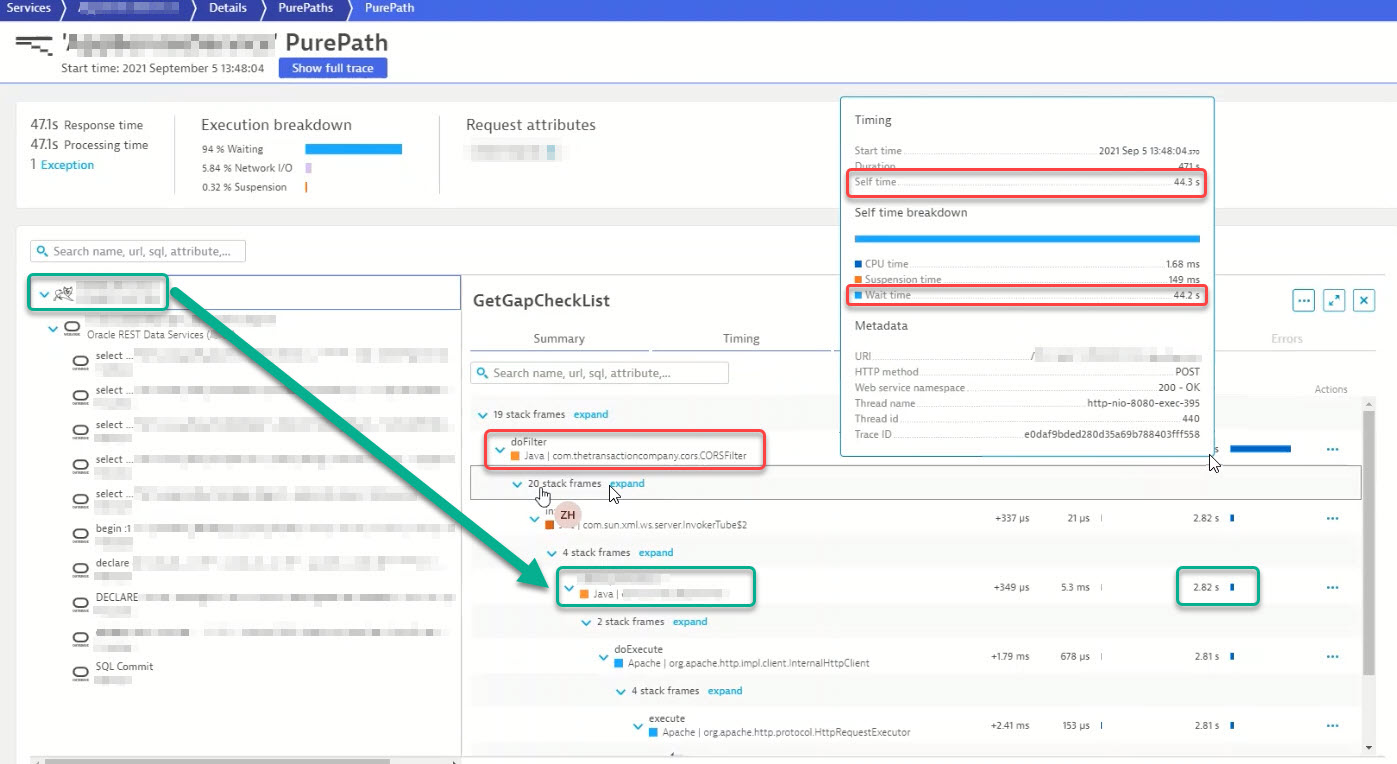
Customer observed from Dynatrace PurePath records that there was certain amount of PurePaths (with similar operations) having response time > 40s. On Dynatrace it advised the method hotspot is with the doFilter operation (attached the PP example that take >47s to complete). The method in problem only took 2.82s to complete and most of the time was with the parent doFilter action. The slow response time issue did not happen all the time and in fact majority of recorded response time of similar PurePath activities complete within 5s. Checked server CPU and memory were sufficient. Checked the process (i.e., Tomcat) thread count was good, and no long-lasting GC was detected at the time the slow PurePaths happened.
In the method hotspot details page it showed most of the time (>90%) had been spent of Waiting. May I ask what components could introduce such delay. Per the stacktrace there are countdownlatch and acquire lock activities detected. These operations seem are not directly written in the AppService code but through the @WebMethod annotation. May I ask how Dynatrace would indicate which actual part of code/method play the biggest role on the delay/blocking.
Thank you very much.
Best Regards,
Zero Ho
Solved! Go to Solution.
Labels:
- Labels:
-
distributed traces
PurePath.jpg
151 KB
Hotspot.jpg
286 KB
5 REPLIES 5
Options
- Mark as New
- Subscribe to RSS Feed
- Permalink
09 Sep 2021 10:38 AM
Hi,
The method hotspots show that most wait time is caused by writing the response to the client, because of the blocking nature of NioBlockingSelector.write(). This might be caused by slow clients or disconnected clients (broken connection)
regards
Harry
Reply
Options
- Mark as New
- Subscribe to RSS Feed
- Permalink
10 Sep 2021 01:49 AM
Dear Harald,
Thanks for the sharing. If the slow clients or disconnected clients would be the case do you recognize any strategy on Dynatrace to monitor these kind of blocking or slow client events?
Because customer checked the network utiliation is not high. Throughput is also far below the limit. Any suggestion how we can reflect a slow client (e.g. slow server-to-client network connection) issue?
Thank you very much.
Best Regards,
Zero Ho
Options
- Mark as New
- Subscribe to RSS Feed
- Permalink
13 Sep 2021 05:23 AM
Hi,
It also might be possible that the client (browser) simply is closed and the response cannot be consumed anymore. Tomcat needs some time to recover from that.
Maybe the stuck thread detection of Tomcat helps here
https://tomcat.apache.org/tomcat-8.5-doc/config/valve.html#Stuck_Thread_Detection_Valve
Best
Harry
Options
- Mark as New
- Subscribe to RSS Feed
- Permalink
20 Sep 2021 11:57 AM
Hi Harry,
Thanks for the sharing. So we will need to study the "extenal" stuck thread detection through Tomcat and observe the findings? It loosk to me Dynatrace does not grab this Tomcat metrics OOTB.
Best Regards,
Zero
Options
- Mark as New
- Subscribe to RSS Feed
- Permalink
20 Sep 2021 12:06 PM - edited 20 Sep 2021 12:06 PM
Hi,
No, there is no OOTB for stuck thread JMX values. You have to create a custom plugin then.
Harry
