Turn on suggestions
Auto-suggest helps you quickly narrow down your search results by suggesting possible matches as you type.
- Dynatrace Community
- Dynatrace
- Ask
- Open Q&A
- Re: Individual Method Performance
Options
- Subscribe to RSS Feed
- Mark Topic as New
- Mark Topic as Read
- Pin this Topic for Current User
- Printer Friendly Page
Options
- Mark as New
- Subscribe to RSS Feed
- Permalink
21 Feb 2021 08:01 AM
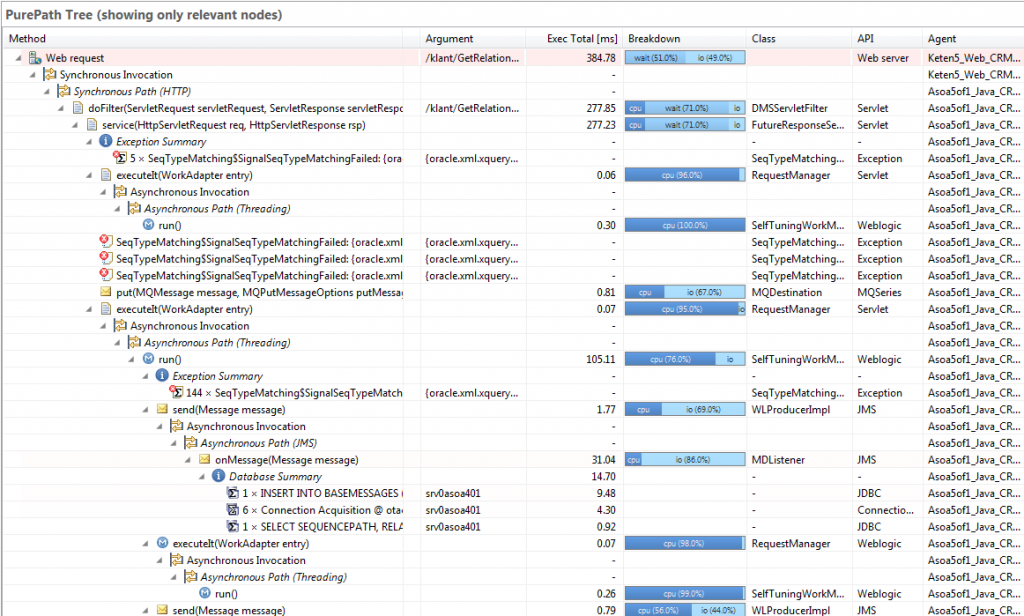
I've not used AppMon, but from what I can see from the pictures, in previous product the PurePath contained all the methods in the call line by line.
In Dynatrace we can only see the service entry point and sampled method hotspots.
What do you think is the main reason for Dynatrace to stop supporting this feature? And can you give me some suggestions about how you guys analyze the whole call stack without adding every single method as a Custom Service? Maybe another tool or a technique I am not aware of?
Solved! Go to Solution.
Labels:
- Labels:
-
services
6 REPLIES 6
Options
- Mark as New
- Subscribe to RSS Feed
- Permalink
21 Feb 2021 08:54 AM
Hello @MUSTAFA SERHAT B.
I am not sure whether I understood your question correctly, but the method hotspots information can be taken from the following location of every process and service as well.

Regards,
Babar
Reply
Options
- Mark as New
- Subscribe to RSS Feed
- Permalink
21 Feb 2021 09:24 AM
Yes, but I can never see something similar to picture below;
It is much more detailed and readable than method hotspots. From what I understand in Dynatrace we collect stacktrace samples.
Does AppMon work the same way? Or does it collect data from every single method in every service call?
Options
- Mark as New
- Subscribe to RSS Feed
- Permalink
21 Feb 2021 10:10 AM
You can see that type of detail at the "Code level" detail, inside a Purepath.
Antonio Sousa
Reply
Options
- Mark as New
- Subscribe to RSS Feed
- Permalink
22 Feb 2021 03:40 AM
"Code level" of PurePath view. To me this is the correct answer. In Dynatrace, on-hover of the code-level, you'll see more information if it's required too. This is not unlike AppMon (webUI view of PurePaths).
You could enhance your diagnostics with method hotspots, as Babar answered. Or even with the response time hotspots view.
Regards,
Andrew M.
Andrew M.
Reply
Options
- Mark as New
- Subscribe to RSS Feed
- Permalink
24 Feb 2021 11:02 AM
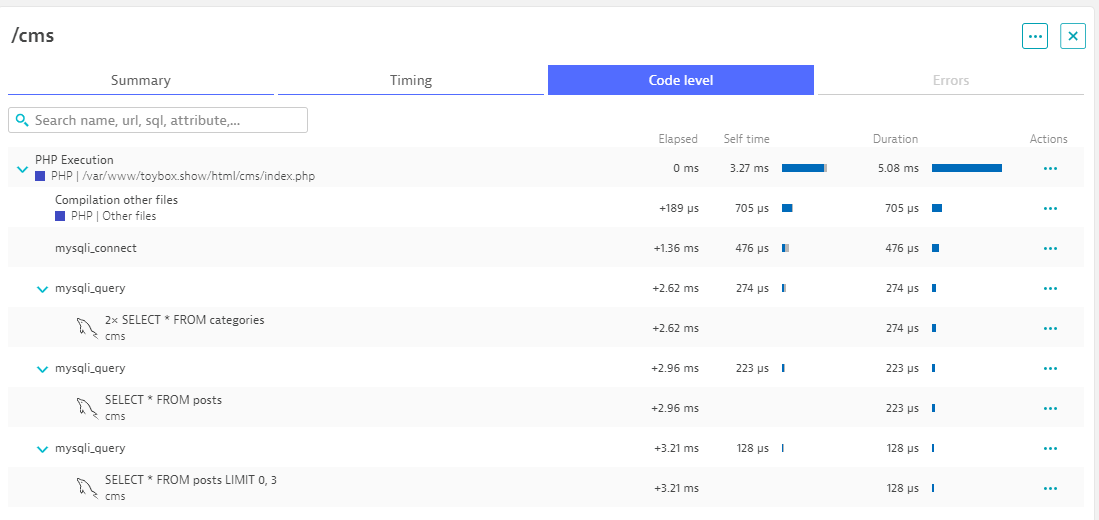
For example, there is a PHP PurePath below. I know that there are some methods which runs to do some internal executings then connect to mysql and fetch the data, but I can't see them in the code level.
It only shows that mysqli_connect & mysqli_query. There should be bunch of executed functions but I can't see them here. The only way I know is to define Custom Service to catch these methods.
Is there a complimentary tool to use with Dynatrace if I see that mysqli_connect took a long time, so I can dig in deeper to every single function/method that is executed and check their individual performance?
Options
- Mark as New
- Subscribe to RSS Feed
- Permalink
12 Mar 2021 04:20 AM
Hi Serhat,
Then I think you need to drill-down to the response time hotspots for the PHP execution, as per Code-level visibility for PHP
Because Dynatrace provides extensive PHP monitoring capabilities:
- All database statements and SQL metrics
- Compilation, execution, and response time analysis
- Detailed request and response metrics
- .... and more!
Andrew M.
Regards,
Andrew M.
Andrew M.
