Turn on suggestions
Auto-suggest helps you quickly narrow down your search results by suggesting possible matches as you type.
- Dynatrace Community
- Dynatrace
- Ask
- Open Q&A
- Re: Multidimensional analysis - no data for short interval -
Options
- Subscribe to RSS Feed
- Mark Topic as New
- Mark Topic as Read
- Pin this Topic for Current User
- Printer Friendly Page
Options
- Mark as New
- Subscribe to RSS Feed
- Permalink
28 Nov 2022
08:09 AM
- last edited on
28 Nov 2022
09:26 AM
by
![]() MaciejNeumann
MaciejNeumann
Hello,
I have a problem with multidimensional analysis, im using a request count metric, with some filter. When i set the time interval to 6 hours or more i can see data fine, but if i try to lower the interval, i got the message that "no data matches your filter setting", but in the long intervall settings i can clearly see there is data.
My question is why DT not showing me data if i try to look for a short interval?
Solved! Go to Solution.
Labels:
- Labels:
-
multidimensional analysis
Reply
7 REPLIES 7
Options
- Mark as New
- Subscribe to RSS Feed
- Permalink
28 Nov 2022 08:37 AM
Hi Akos,
What is exactly the Metric expression used ? can you attach some screenshots please ?
For me , all depend on your timespan (datapoints per min) and also about your Metric expression.
Options
- Mark as New
- Subscribe to RSS Feed
- Permalink
28 Nov 2022 08:42 AM
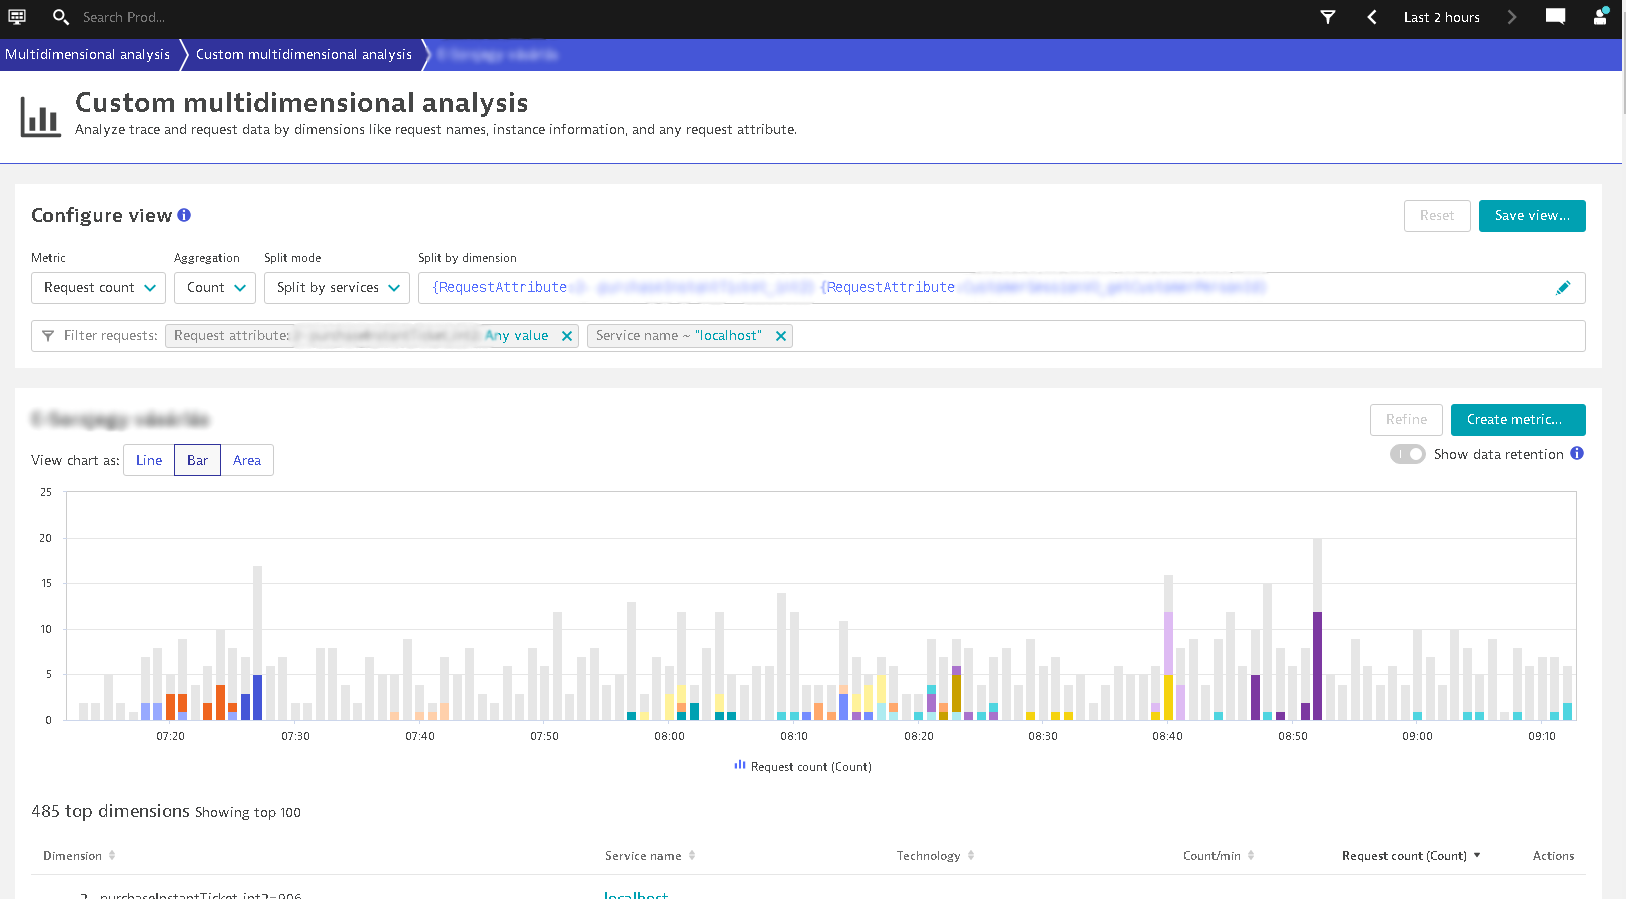
Hey, here are some images , with different time frame, and with the same filters.
2hours.png
95 KB
30min.png
67 KB
Reply
Options
- Mark as New
- Subscribe to RSS Feed
- Permalink
28 Nov 2022 09:25 AM
Here you are using MDA chart (Multidimensional Analysis).
AFAIK, actually you are using "Trace and request data" , namely given that when you use 20-40 min timeframe, your interval granularity is at 20 sec ... so need to check your infra disk capabalities.
Unlike to "more than 1 hour" timeframe , where your interval granularity is 1 min , so enough for generating your datapoints !
By default in order to capture your datapoints, need to have at least 1 min of resolution!
You can accomplish this via Metric selector into Data Explorer , so via calculated service metrics.
"Trace & request data" VS "Metric data"
https://www.dynatrace.com/support/help/how-to-use-dynatrace/services/analysis#tabgroup--data-pools--...
Another important info :
Be aware of using MDA, the data is stored into "Transaction storage" filesystem" wich is less relevant/accurate looking retention data storage and depend on your space disk capacity. Unlike to metrics storage (Cassandra) , where the use of Metric chart via Data Explorer is accurate and use for Timeseries.
To achieve this, I recommend to create "calculated service metrics" , then you can enjoy it via Data Explorer tile.
FYI :
https://www.dynatrace.com/support/help/how-to-use-dynatrace/diagnostics/multidimensional-analysis#ex...
Unlike the Data explorer, multidimensional analysis uses trace and request data, not metric data, so values on multidimensional analysis charts might differ from values on custom charts.
Reply
Options
- Mark as New
- Subscribe to RSS Feed
- Permalink
29 Nov 2022 07:39 AM
Actually i used this fuction that i mentioned in the first post, the short interval search almost everyday, not for the chart, but for the data below the chart.
Btw on the attached image (2hours.png) we see data, but sometimes, it has only on 6 hours or wider time interval.
Options
- Mark as New
- Subscribe to RSS Feed
- Permalink
30 Nov 2022 12:26 PM
What happens when you go to the "Distributed Traces" list with the same filters and same timeframes.
Is it also only showing traces in the long timeframe and not in the short one?
Options
- Mark as New
- Subscribe to RSS Feed
- Permalink
01 Dec 2022 06:52 AM
I tried now, but I got the same result like in the MDA
Options
- Mark as New
- Subscribe to RSS Feed
- Permalink
01 Dec 2022 07:42 AM
Please gather the links and talk with support, they can forward everything to the right DEV team then they can best investigate by looking at the data. IMO this should not happen.
Reply
