- Dynatrace Community
- Dynatrace
- Ask
- Open Q&A
- Re: Service response time split by host (or CPD)
- Subscribe to RSS Feed
- Mark Topic as New
- Mark Topic as Read
- Pin this Topic for Current User
- Printer Friendly Page
Service response time split by host (or CPD)
- Mark as New
- Subscribe to RSS Feed
- Permalink
12 Apr 2021
11:42 AM
- last edited on
28 Sep 2022
10:30 AM
by
![]() MaciejNeumann
MaciejNeumann
Hi all,
we've one service S1 shared by several hosts: host1-cpd1, host2-cpd1, host1-cpd2, host2-cpd2.
The host name contains one ID for the CPD in with the host is deployed (cpd1 or cpd2 in the example)
How can I offer one dashboard with the response time for he service S1 splitted by CPD?
Thanks in advance!
- Labels:
-
host monitoring
-
services
-
tagging
- Mark as New
- Subscribe to RSS Feed
- Permalink
12 Apr 2021 04:09 PM - edited 12 Apr 2021 04:11 PM
Hello @jcamps
Below steps may help.
- Create valid tag/host group cdp1 or cdp2
- Create dashboard
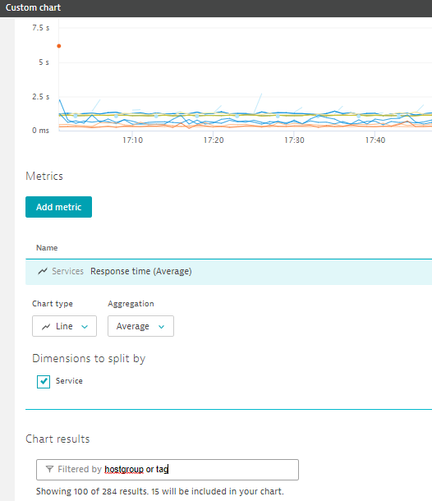
- Add custom chart & configure custom chart
- Select Response time
- For filtering use Chart Results for host. Tag or group can be used here.
Cheers!
R
- Mark as New
- Subscribe to RSS Feed
- Permalink
12 Apr 2021 04:33 PM
Hi @RazTN7,
thanks for your response! I can't TAG or create a HOST GROUP for CPD1 and CPD2 because I need also the unified view for the S1.
If I define a HOST GROUP for each CPD the service S1 is splitted in two services, one foreach HOST GROUP and this is not correct! I need the two dimensions for the S1 metrics:
- With the metrics unified for the 2 CPDs
- With the metrics splitted by CPD
Same problem with TAGs, I can define one TAG with the correct CPD foreach host but this TAG can't be propagated to the process groups or the services because are unified.
Is what I comment correct?
Thanks! Josep Maria
- Mark as New
- Subscribe to RSS Feed
- Permalink
12 Apr 2021 05:29 PM
Afik you can't.
MDA is the only place to get that View. And you cant create a metric since a service instance cant be used to create a metric: {Service:Instance} is not allowed as placeholder.
You could create a View and link that view in a Dashboard.
- Mark as New
- Subscribe to RSS Feed
- Permalink
13 Apr 2021 02:08 PM
As @Anonymous already pointed out the only way to archive this currently is to use MDA or you would need to split the instances by utilizing hostgroups etc.
We had and have the same issue and our case we decided to split our instances by hostgroup since it was important for us that we can present the service level data per host on our custom dashboards.
Not the road we wanted to go but in our case the MDA was not enough and since the normal custom dashboards are quite limited in this manner we were "forced" to split the services per instance.
- Mark as New
- Subscribe to RSS Feed
- Permalink
13 Apr 2021 02:17 PM
Hi @janne_olkoniemi,
as you say, there's no way to achieve the 2 dimensions together... But not seems to be a strange requirement, isn't?
My service are logically the same in the two CPD but I want to put in my high level dashboards the performance splitted by CPD and also globally in order to see possible performance differences between them.
Regards, Josep Maria
- Mark as New
- Subscribe to RSS Feed
- Permalink
13 Apr 2021 02:30 PM
I will check tomorrow also that if there is already RFE about this topic since this is quite a basic functionality what we are looking for.
I totally get your need and we had similar case that since in this case there are only few of servers which are serving the service it was quite crucial to team to see the response time or request count per server on their custom dashboard.
So that's why we decided to split the services per server which is honestly the road we wanted to avoid since it's causing own headache also in many manners also.

