- Dynatrace Community
- Dynatrace
- Ask
- Open Q&A
- The Problems with Adaptive Traffic Management Version 2 - Dynatrace SaaS
- Subscribe to RSS Feed
- Mark Topic as New
- Mark Topic as Read
- Pin this Topic for Current User
- Printer Friendly Page
The Problems with Adaptive Traffic Management Version 2 - Dynatrace SaaS
- Mark as New
- Subscribe to RSS Feed
- Permalink
08 Feb 2022
09:55 AM
- last edited on
25 Mar 2022
12:48 PM
by
![]() MaciejNeumann
MaciejNeumann
I'm currently struggling a lot at a customer with data quality of Dynatrace captured transactions. The numbers presented on some services just didn't make sense. For example Dynatrace showed what seemed to be massive peaks in transactions and then almost no traffic at all, whereas we all knew that this was a service which should show a normal distributed load of requests.
Turns out the new adaptive traffic management is impacting the data quality a lot. Let me dive a bit deeper:
The Scenario
The environment we are looking at is a modern eCommerce platform (K8s microservices, legacy backends, monolithic VMs, all there...). The nature of modern sites is a heavy use of APIs and services, with lots of requests, all automatically picked up by Dynatrace of course. And here the problem starts.
Aggregation of Service Calls and Purepaths
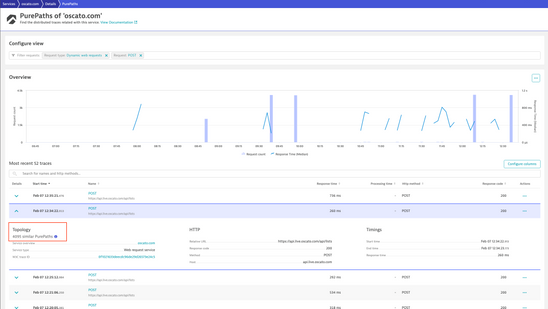
I noticed this behavior on a external service (payment provider):
This service view suggests that every now and then there is a huge spike in calls to the service (notice the 4k requests spikes), and then for a couple hours there is almost no traffic (you can't see the 10 requests/min in the chart due to scale).
However this is not what happens in reality! In reality there is a constant level of calls to the service. It is just that Dynatrace is aggregating PurePaths together into the same point of time!
The magic limit seems to be 4095 Purpaths merged into one. Sometimes this is 15 PPs and then occasionally it jumps to 4k.
Turns out that this is due to the adaptive traffic management - more on that further down.
The bad impact of this
Now I was wondering why I cannot see some key requests (payment requests that happen at a low load - but do happen). It seems that those fall victim to the traffic management also!
Problem 1: key requests aren't properly tracked anymore!
Then I was wondering how one could chart and baseline the service's response time properly if such massive aggregation of transactions into one point happens. Basically you can't. As you see on the chart above, there are gaps in the response time metric.
Problem 2: charting, baselining of service metrics gets impacted, likely also problem detection?
What about custom metrics? If I had custom metrics defined on these service calls, would they still work? I believe not, they would not be correct due to the massive aggregation.
Problem 3: service metrics get impacted
Self-Monitoring
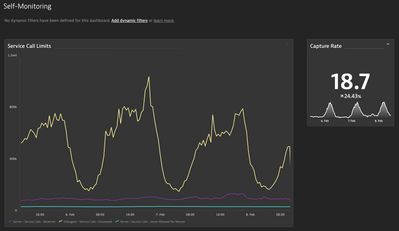
We now have self monitoring metrics available that allow us to see how bad you get impacted by the adaptive traffic management. E.g. you can put these on a chart to - simply spoken - see how much data you are losing in Dynatrace due to this algorithm:
In my case the "capture rate" is somewhere between 15-20%. Meaning I'm only getting one fifth (!!) of the data across the whole environment. Some services maybe even less!
That is a huge impact!
We know that the number of host units in your license are taken to calculate how many service requests your SaaS tenant will process for you. That can cause a problem!
I work with customers that have legacy systems with big host units and a low number of service calls (due to the architecture) and then I have customers with an efficient K8s based microservice and responsive architecture with lots of service/api calls. The legacy architectures barely get impacted and have a capture rate close to 100, whereas the modern architectures can get reduced by 85% and have a big impact in visibility and data quality.
Solutions?
First: I thought optimizing the number of service requests never hurts. E.g. by excluding incoming webrequests globally. But, this has limits.
- It only works for "entry point" requests. Calls to external service performed by the own backend can't be limited this way.
- It's a all-or-nothing, you can't say: capture a max of 50% so that I still have some visibility
Second: don't use SaaS!? In managed you can adopt this rate limit of service requests yourself, and I know that you can in most cases increase that limit massively. But if Dynatrace generally wants to go SaaS or customers sometimes prefer SaaS so we need a better solution for SaaS.
Third: We'd need a solution that is designed for modern architectures and doesn't tie to a rigid metric like host units in the license.
I believe for certain architectures like this limiting can't be done like this.
- Mark as New
- Subscribe to RSS Feed
- Permalink
08 Feb 2022 10:48 AM - edited 25 Aug 2022 11:38 AM
Basically all my current customers use Managed so I haven't run into this.
But such a low capture rate paired with the erratic aggregation would be a deal breaker for recommending SaaS, if this is working as intended.
But from the performance clinic on the topic , I'm quite hopeful that 10-20% ist not an expected capture rate.
- Mark as New
- Subscribe to RSS Feed
- Permalink
08 Feb 2022 12:57 PM
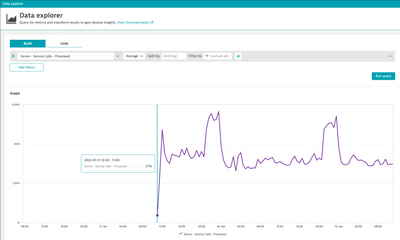
Here is the proof that custom service metric can get heavily impacted by this adaptive capture control. From the time when this was introduced (in my case on Jan. 17th - as can be seen on the availability of the self monitoring metric) my custom metrics (e.g number of orders) do not work properly anymore:
Suddenly there are "spikes" in this metric at points in time and then no data at other points in time at all.
The data is messed up and not reliable anymore.
- Mark as New
- Subscribe to RSS Feed
- Permalink
05 Sep 2022 05:36 AM
Thanks @r_weber for bringing this to attention.
I am seeing if there is some further explanation to this behavior and the reasoning behind it apart from what is already documented on the help page: https://www.dynatrace.com/support/help/shortlink/adaptive-capture-control#saas-vs-managed-adaptive-t...
Andrew M.


