- Dynatrace Community
- Dynatrace
- Ask
- Open Q&A
- Re: When process has error detected, want to show services error that is related to process at smartscape
- Subscribe to RSS Feed
- Mark Topic as New
- Mark Topic as Read
- Pin this Topic for Current User
- Printer Friendly Page
- Mark as New
- Subscribe to RSS Feed
- Permalink
29 Mar 2023 05:29 AM - edited 29 Mar 2023 07:12 AM
Hi all
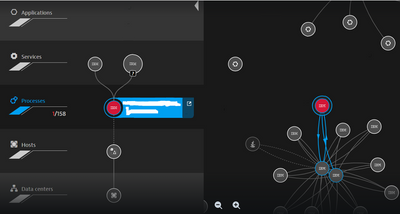
When the process has error detected, want to show services error that is related to process at smartscape.
At the below picture, process occurs an error. At that time I want to show red color in services that are related to that process.
Solved! Go to Solution.
- Labels:
-
processes
-
services
-
smartscape
- Mark as New
- Subscribe to RSS Feed
- Permalink
29 Mar 2023 05:52 AM
As detailed in the documentation for the smartscape, it only shows entities as red if that entity specifically has a problem. https://www.dynatrace.com/support/help/shortlink/smartscape#problems
So for example that process has a problem but the 8 services on that process do not and so they wouldn't show in red. If both the process and the services had a problem then the services would also show in red.
If in your example you're saying the services are experiencing some problem and Dynatrace hasn't detected it, then you will need to either change anomaly detection settings for those services OR configure custom metric events to create problems.
Hope this helps
- Mark as New
- Subscribe to RSS Feed
- Permalink
29 Mar 2023 06:02 AM - edited 29 Mar 2023 07:14 AM
Thank you so much for your reply.
I also created custom metric events for service and when service had a problem then the services show in red.
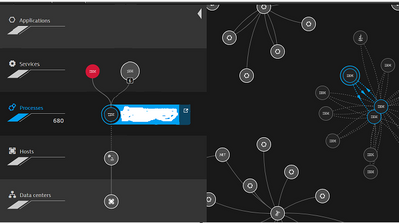
But ,process has a problem but the 2 services on that process do not and I want to show process and 2 serviecs in red.
In this condition ,how to create custom metric events that is affected to service and process?
- Mark as New
- Subscribe to RSS Feed
- Permalink
29 Mar 2023 09:14 PM
I don't think this is a good idea as it misrepresents what is currently happening within your environment but, you can create a metric expression that is split by a service but is representative of a different entities metric.
For example:
(builtin:service.errors.total.rate:splitBy("dt.entity.service") / builtin:service.errors.total.rate:splitBy("dt.entity.service")):default(1) * builtin:pgi.availability:splitBy()
The above takes a service metric, splits by the service entities, divides by itself to get 1 for each instance of the metric, defaults to 1 for any missing data points, and then multiplies itself by a process metric to then take on the value of the process metric. This allows us to maintain the services as a dimension while using the processes metric. Unfortunately when I tested this in the metric events page it used too many dimensions even when filtered for 1 service. So, I'm not sure that there is an easy way to do it.


