- Dynatrace Community
- Learn
- Dynatrace tips
- Re: DSFM metrics: Active Gate internal metrics
- Subscribe to RSS Feed
- Mark Topic as New
- Mark Topic as Read
- Pin this Topic for Current User
- Printer Friendly Page
DSFM metrics: Active Gate internal metrics
- Mark as New
- Subscribe to RSS Feed
- Permalink
30 Sep 2021
06:08 PM
- last edited on
19 Oct 2022
01:57 PM
by
![]() MaciejNeumann
MaciejNeumann
Hi, everyone!
A few day ago, I stumbled across some metrics I have not yet seen before: they all started with "dsfm"... and they gave surprising information!
Things like Active Gate, Extensions, ![]() Cluster data... something I have never seen made public by Dynatrace!
Cluster data... something I have never seen made public by Dynatrace!
A few examples:
I have searched on the documentation, and have found no information on this... so, I figure it might be really new, right? 👀
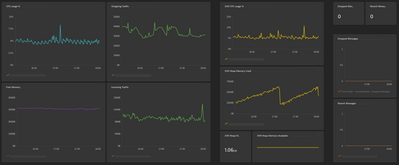
As I really needed some info on an Active Gate for a client, I already produced a simple (but really helpful ![]() ) dashboard:
) dashboard:
I got really excited, as this opens a world of insightful possibilities!
This is great! ![]()
- Labels:
-
self-monitoring
-
tips and tricks
- Mark as New
- Subscribe to RSS Feed
- Permalink
01 Oct 2021 08:44 AM
Have to admit, right now the Product team has move so fast so that, the Documentation team is too 'slow' to catch-up with them to update the Doc.
But who know? Is this a good sign or bad sign 🤷🏻♂️
- Mark as New
- Subscribe to RSS Feed
- Permalink
13 Jan 2022 09:38 AM
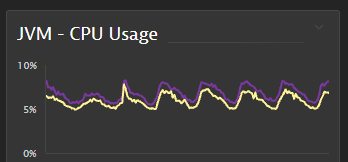
In Local Self monitoring, I cant find the dsfm data for Active Gate JVM CPU Usage% however when I switch to my managed tenant, I can see its data. The documentation team really needs to catch up so that we can know how to use this DSFM and local self monitoring wisely for client benefits.
- Mark as New
- Subscribe to RSS Feed
- Permalink
13 Jan 2022 11:47 AM
Hello @Raj
Did you find the below metric? What is the cluster version?
dsfm:active_gate.jvm.cpu_usage:filter(and(or(eq("host.name","HOST_NAME"),eq("host.name","HOST_NAME")))):splitBy("host.name"):avg:auto:sort(value(avg,descending)):limit(10)
Regards,
Babar
- Mark as New
- Subscribe to RSS Feed
- Permalink
13 Jan 2022 11:52 AM
Hi Babar, yes I am able to see the metric however when I run the query, it says No Data. Cluster version is 1.230.138
- Mark as New
- Subscribe to RSS Feed
- Permalink
13 Jan 2022 11:56 AM
Hello @Raj
Strange. You are already on the latest version. Did you filter out the ActiveGate hosts?
What is the version of ActiveGates?
Regards,
Babar
- Mark as New
- Subscribe to RSS Feed
- Permalink
13 Jan 2022 02:35 PM
Yes I did filter AG hosts but AG are on version 1.227 - does it needs to be increased to any particular version in order to see their metric data? I even raised a support ticket and yet to hear from them on this issue.
- Mark as New
- Subscribe to RSS Feed
- Permalink
07 Feb 2024 06:48 PM
dsfm:active_gate.communication.incoming_traffic:filter(and(or(eq("host.name","HOST_NAME"),eq("host.name","HOST_NAME")))):splitBy("host.name"):avg:auto:sort(value(avg,descending)):limit(100)
Thanks Babar, I used the above code - I hope this is useful to others in order to see the incoming and outgoing traffic on our Active Gates - since we monitor our In House Infra using a DT located in the cloud.
Featured Posts


