- Dynatrace Community
- Learn
- Dynatrace tips
- Re: Finding Javascript Error Stack trace
- Subscribe to RSS Feed
- Mark Topic as New
- Mark Topic as Read
- Pin this Topic for Current User
- Printer Friendly Page
Finding Javascript Error Stack trace
- Mark as New
- Subscribe to RSS Feed
- Permalink
28 Aug 2015
09:28 PM
- last edited on
04 Sep 2023
10:18 AM
by
![]() MaciejNeumann
MaciejNeumann
Javascript errors not only break parts of your page, but can also render the entire application unresponsive to the end user. It is most crucial for a web developer to be able to find the Javascript errors and fix them before they have a negative impact on the end user performance.
Finding the error details:
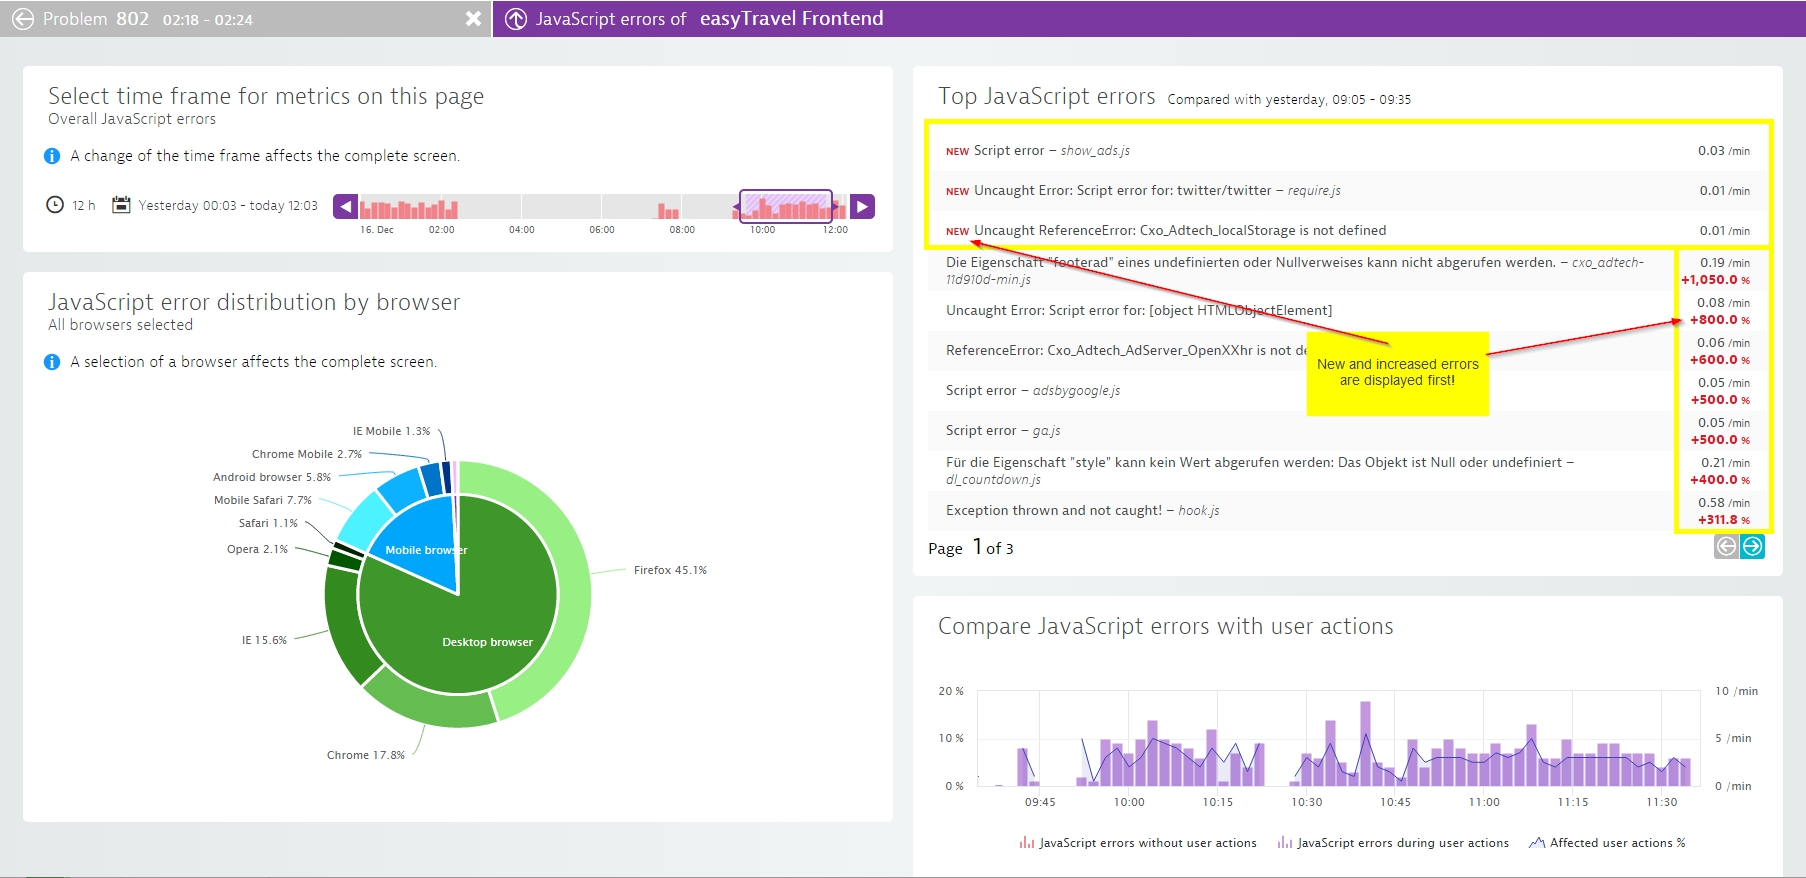
Dynatrace makes it easy to find the Javascript errors and provides line numbers and stack traces which can be used to fix them. The Stack trace can be accessed by first selecting the Application and then clicking on the JavaScript errors on the infographic. This shows the Javascript error details view:

On this view you can find the number of errors for a particular time frame, number of user actions being effected by the errors and the distribution of browsers (with version) on which the end users are experiencing them.
Finding the stack trace:
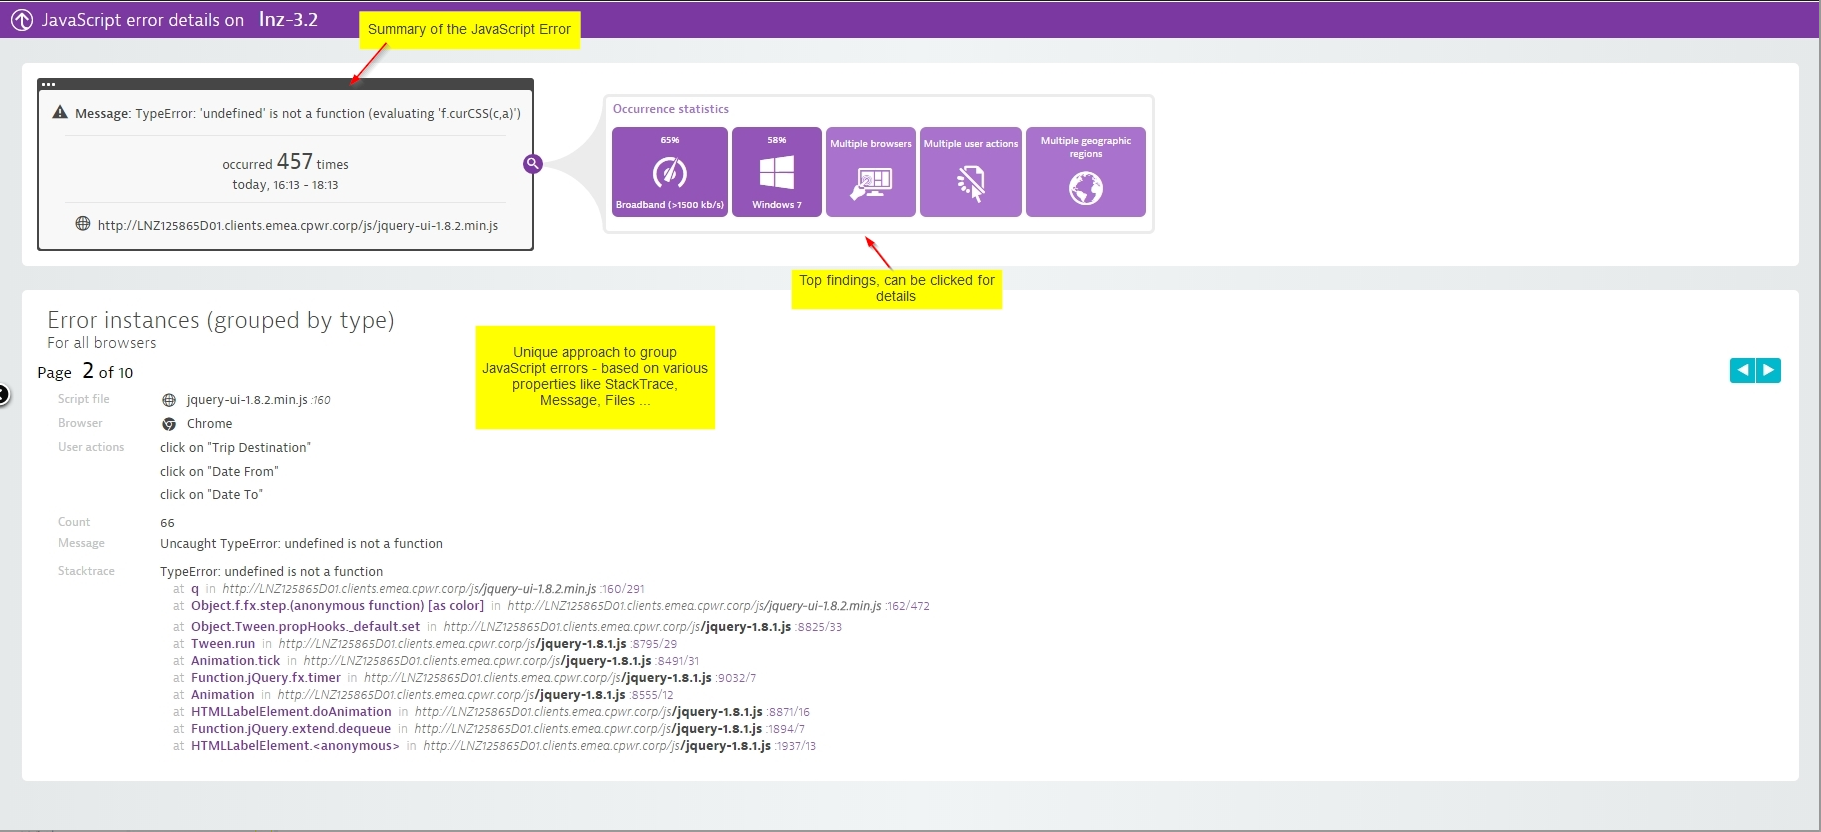
Clicking on a particular Javascript error leads to stack trace, line of code, browsers, OS and Geo Location for the error:

Fixing the Javascript errors is now made easy by providing you with the exact line of code and the stack trace!
- Labels:
-
tips and tricks
-
tipstricks
- Mark as New
- Subscribe to RSS Feed
- Permalink
10 Jan 2019 03:33 PM
Where's this screen located in the dynatrace 7 client?
- Mark as New
- Subscribe to RSS Feed
- Permalink
10 Jan 2019 03:58 PM
Hi David,
The screen above is for Dynatrace SaaS/Managed and not AppMon.
Thanks
NJ
Featured Posts
