- Dynatrace Community
- Learn
- Dynatrace tips
- Re: PRO TIP - New Metric Host Availability State
- Subscribe to RSS Feed
- Mark Topic as New
- Mark Topic as Read
- Pin this Topic for Current User
- Printer Friendly Page
PRO TIP - New Metric Host Availability State
- Mark as New
- Subscribe to RSS Feed
- Permalink
23 Mar 2023 12:29 PM
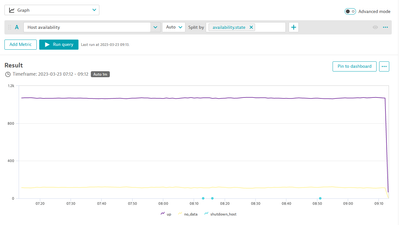
With the release of OneAgent 1.261 a new and long awaited metric is available!!!
The OneAgent OS module now reports the host availability state as a metric.
Metric key: builtin:host.availability.state
Reported states:
- UP - host working, OneAgent active and sending data
- NO_DATA - host working, OneAgent active but not sending data
- NO_DATA_AGENT_INACTIVE - host working, OneAgent inactive (disabled manually in configuration) and not sending data
- SHUTDWON_HOST - host has been shut down
- UNMONITORED_AGENT_STOPPED - host unmonitored: OneAgent stopped
- UNMONITORED_AGENT_UPGRADE - host unmonitored: OneAgent in upgrade
- UNMONITORED_AGENT_UNINSTALLED - host unmonitored: OneAgent uninstalled
The resolution is 1 minute: states are sent every minute, always with the value 1, which means that the reported state occurred in the given minute. If there is no sample with the given state, it means that the state was not detected in this minute.
Why is important?
Because it allow us to generate alerts based on different use cases:
- Unistalled OneAgents
- Stopped OneAgents
- OneAgents that are working but no data is received.
- OneAgents manually disabled .
and thus improve the management we have over the deployed OneAgents
![]()
![]() Thanks
Thanks ![]() Dynatrace
Dynatrace ![]() Team!!!!
Team!!!!
- Labels:
-
metrics
-
oneagent
-
tips and tricks
- Mark as New
- Subscribe to RSS Feed
- Permalink
23 Mar 2023 12:34 PM
Great - it will be very useful!
- Mark as New
- Subscribe to RSS Feed
- Permalink
30 Mar 2023
06:34 PM
- last edited on
30 Mar 2023
07:17 PM
by
![]() AgataWlodarczyk
AgataWlodarczyk
Thanks for this info @DanielS What should be the threshold if I use the metric key "builtin:host.availability.state" to create a Metric Event? I need a Metric event when the actual host is down. What should be threshold?
- Mark as New
- Subscribe to RSS Feed
- Permalink
30 Mar 2023 07:08 PM
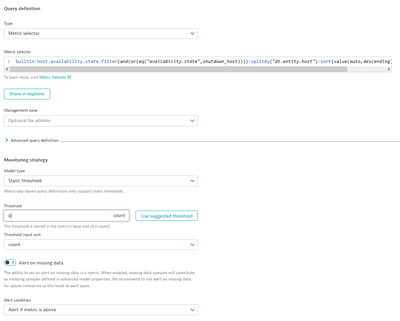
Hello @JDS thanks, you could use the metric selector option with this text:
builtin:host.availability.state:filter(and(or(eq("availability.state",shutdown_host)))):splitBy("dt.entity.host"):sort(value(auto,descending)):limit(100)Also if you want to add more "down states" you could do it:
builtin:host.availability.state:filter(and(or(eq("availability.state",shutdown_host),eq("availability.state",unmonitored_agent_stopped)))):splitBy("dt.entity.host"):count:sort(value(avg,descending)):limit(100)
- Mark as New
- Subscribe to RSS Feed
- Permalink
30 Mar 2023 07:27 PM
Thanks @DanielS I tried to see additional options in data explorer but I am getting on "no_data" and "up" states alone. If I use the this expression in Metric selector what should be the value of the threshold that will trigger an event when the host goes down?
I tried using the host availability percentage metric but it isn't scaling as the allowed dimension is only 5000. We have around 12K hosts in our Non-Production environment.
- Mark as New
- Subscribe to RSS Feed
- Permalink
30 Mar 2023 07:35 PM
Hi @JDS, you didn't see the other states because you don't have such events in the selected time window. I have posted all the events in my first post, try using them in the filters, when they are at 0 and go up to 1 this will trigger the event. I guess this is the best approach.
- Mark as New
- Subscribe to RSS Feed
- Permalink
30 Mar 2023 08:31 PM
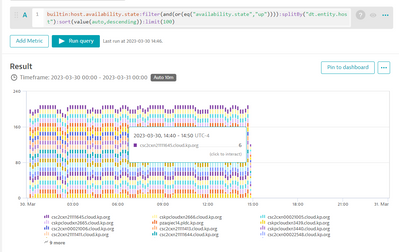
Thanks @DanielS. I used this Metric selector expression "builtin:host.availability.state:filter(and(or(eq("availability.state","up")))):splitBy("dt.entity.host"):sort(value(auto,descending)):limit(100)" and received the data points shown in the screenshot.
I don't understand what does the value 10, 6, 12, etc. means? Also what does the values in the Y axis stands for? The values in X axis refers to the time line which I is clear for me.
- Mark as New
- Subscribe to RSS Feed
- Permalink
30 Mar 2023 10:15 PM
Hi @JDS if you use up as state you are going to see the count of all host that are in up state. In that case you need to know the quantity and trigger the alert when this decrease.
- Mark as New
- Subscribe to RSS Feed
- Permalink
31 Mar 2023 01:19 AM
uh understood, @DanielS If I need to use the UP state monitor and if I have 1k hosts in our environment then the threshold for this Metric event will be 1000 so it will trigger an alert when the count is less than the threshold, correct.
I am looking for an alert to be triggered when any specific host in the environment is down where the alert/dynatrace problem generated will tell me the specific host as down which I can send to server team through problem notification
- Mark as New
- Subscribe to RSS Feed
- Permalink
07 May 2025 11:45 AM
Hi @JDS
can you please help me if you have an option to filter specific host wise?
and please what metric selector you are using?
Best regards
Chaitanya
- Mark as New
- Subscribe to RSS Feed
- Permalink
09 May 2025 11:23 AM
Hello @DanielS ,
I have used this below metric selector
builtin:host.availability.state:splitBy("availability.state","dt.entity.host"):sort(value(count,descending))
and would like to add metric event for the state other than "UP". But I can see all the states returns same value as 1440 or 1439 for 24hours timeframe.
Could you please help me how best we can achieve this to get the host availability alert for particular host?
Best regards
Chaitanya
- Mark as New
- Subscribe to RSS Feed
- Permalink
31 Mar 2023 02:23 AM
Definitely a great improvement here. Have you been able to get a problem to remain open when the agent is not running? Creating a problem is no issue but it closes shortly after even when the agent is still not running. I assume it is because there is no continuous datapoint of 1 for the unmonitored_agent_stopped state, you only get the initial 1 datapoint when the agent stops.
- Mark as New
- Subscribe to RSS Feed
- Permalink
31 Mar 2023 05:18 PM
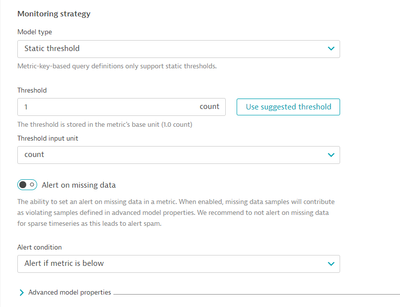
thanks @sivart_89 but you can alert on missing data also:
- Mark as New
- Subscribe to RSS Feed
- Permalink
07 Jun 2024 06:45 PM
Hi experts, regarding this topic, is it possible to obtain the time in which a host was in the shutdown state?
- Mark as New
- Subscribe to RSS Feed
- Permalink
16 Sep 2025 01:32 AM
I still can't understand how to use this metric to tell me the current state of the host. Would love to know not only that at some point within the timeframe the host became unmonitored but that it is still in an unmonitored state. I can see the info from the deployment status but a dashboard tile showing this info would be amazing!
Featured Posts


