- Dynatrace Community
- Ask
- Extensions
- Re: JMX Extension for Kafka Status
- Subscribe to RSS Feed
- Mark Topic as New
- Mark Topic as Read
- Pin this Topic for Current User
- Printer Friendly Page
- Mark as New
- Subscribe to RSS Feed
- Permalink
25 Sep 2023 09:56 PM - edited 25 Sep 2023 09:57 PM
Hi everyone,
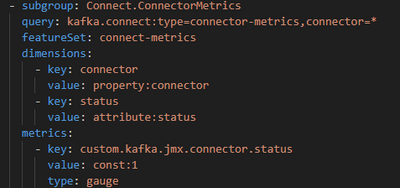
I've created a 2.0 JMX extension to pull out the kafka status metric for confluent kafka. I am able to see some connector status' but not all of them. In addition to that it seems the status will show as running when in fact it is failed as shown in the kafka console. Any thoughts of where to look at to figure out the issue? Anyone been able to pull in the connector status for confluent kafka? Below is a snippet from the yaml.
Solved! Go to Solution.
- Labels:
-
extensions
-
jmx
-
kafka
- Mark as New
- Subscribe to RSS Feed
- Permalink
26 Sep 2023 08:25 AM
Seems like the MBean you're capturing is for the connector itself, which can only have the values for running, paused or stopped. If you're expecting to see failed, it might mean you actually want to capture a task's status instead of the connector itself, so maybe something like this is what you're looking for:
        - subgroup: Connect.ConnectorMetrics
          query: kafka.connect:type=connector-metrics,connector=*,task=*
          featureSet: connect-metrics
          dimensions:
            - key: connector
              value: property:connector
            - key: task
              value: property:task
            - key: status
              value: attribute:status
          metrics:
            - key: kafka.connector.task.status
              value: const:1
              type: gauge
Source: https://docs.confluent.io/platform/current/connect/monitoring.html#connector-metrics
- Mark as New
- Subscribe to RSS Feed
- Permalink
26 Sep 2023 08:19 PM
Good catch here! I have added this in but our count is still not matching up with Kafka shows. Do you know if the status metric is 'exposed' only once when the status is changed?
Our thought process was that we may have tasks that have been in a failed state for a period time before the extension started collecting the metric. We are trying to do some testing here to get more info.
- Mark as New
- Subscribe to RSS Feed
- Permalink
27 Sep 2023 08:13 AM
As per the documentation, it should be the current state, so there's definitely a difference between how the MBean exposed metric is being counted and how your Kafka console is counting it. Difficult to troubleshoot further.
- Mark as New
- Subscribe to RSS Feed
- Permalink
27 Sep 2023 03:57 PM - edited 27 Sep 2023 04:17 PM
So, I found that the status metric in dynatrace is only updated after I push a newer version of the extension. The change is not relevant, I simply update the version to allow for it to be uploaded. Once I apply the new version to the monitoring configuration I can then see something such as the below in the logs. After a minute or so of 'installing' the newer version then I see that updated status in dynatrace.
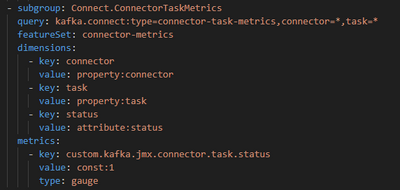
Ever seen something like this or know what could be causing this? Below is the yaml I have so far.
2023-09-27 14:14:02.599 UTC [003b195f] info [java ] [metrics ] Uninstalling monitoring config of JMX extension 'custom:kafka.jmx.misc.metrics' (version 1.0.2)
2023-09-27 14:14:03.600 UTC [003b195f] info [java ] [metrics ] Installing monitoring config of JMX extension 'custom:kafka.jmx.misc.metrics' (version 1.0.3)
- Mark as New
- Subscribe to RSS Feed
- Permalink
27 Sep 2023 05:11 PM
The logs are completely normal, it's just telling you it's going to download and use the new version since you updated it. What exactly do you see in Dynatrace, that you feel only gets updated when you upload a new version? Consider that with the above definition, the metric's value is always 1 and only the status attribute changes over time. Also, consider checking the configured frequency, if any, as it might just capture the metric every X minutes and you might not be giving it enough time.
- Mark as New
- Subscribe to RSS Feed
- Permalink
27 Sep 2023 09:34 PM
I am fine with a value of 1 always showing, I understand why that is occurring. What I don't understand is why the status of the connector task is only updated when I publish a new version of the extension. A datapoint is logged in data explorer every 1 minute but the status is only ever updated when I update the extension.
- Mark as New
- Subscribe to RSS Feed
- Permalink
04 Oct 2023 07:54 AM
I think I understand the issue, when you set the value to const:1, the JMX Datasource is reading the MBean once and then providing a constant value, including the dimensions, even if the value of the dimension changes.
Can you try changing the whole thing to something like this:
        - subgroup: Connect.ConnectorMetrics
          query: kafka.connect:type=connector-metrics,connector=*,task=*
          featureSet: connect-metrics
          dimensions:
            - key: connector
              value: property:connector
            - key: task
              value: property:task
            - key: status
              value: attribute:status
          metrics:
            - key: kafka.connector.task.status
              value:
                attribute: status
                accessor: equals("running")
              type: gauge
This will give the metric a value of 1 if the status is running or 0 otherwise, and should update every time the value of status changes.
- Mark as New
- Subscribe to RSS Feed
- Permalink
04 Oct 2023
12:36 PM
- last edited on
09 Oct 2023
01:12 PM
by
![]() AgataWlodarczyk
AgataWlodarczyk
Thank you @victor_balbuena for continuing to look at this! I have made this change and waiting for the app team to change a connector status to see if this gets picked up.
Question, is there a way we can have the extension to always report back the current status? Our use case is alert if the status is not running and if the above changes work then we should be good but taking it a step further it would be good to always get the current status rather than logging a 0 if the status is not running, the task status could be any 1 of the below according to https://docs.confluent.io/platform/current/connect/monitoring.html#common-task-metrics
As a note, we originally were looking at the connector status but the app teams have since come back and wanted to alert if the task status is anything but running.
unassigned, running, paused, failed, or destroyed
- Mark as New
- Subscribe to RSS Feed
- Permalink
04 Oct 2023 12:55 PM
As an update to my post above, I may have spoken too soon. I am seeing other status' showing in dynatrace now so it looks promising so far. Still waiting on our app team to help me validate things.
- Mark as New
- Subscribe to RSS Feed
- Permalink
04 Oct 2023 12:57 PM
I was just typing:
If you have the dimensions section in your metric inside the yaml file, just like we can see in my example above, then you will get the current status as a dimension, regardless of the value. It is not the most elegant solution, but you can always create a metric event in Dynatrace for a specific value of a dimension in a metric, so in this case you would need to alert when status = unassigned, when status = paused, when status = failed and when status = destroyed, so a total of 4 metric events for this. Or you can alert when the value is 0 and show the value of the status dimension on the description of the metric event.
Seems like you figured it out, but still leaving it here for clarification 😄
- Mark as New
- Subscribe to RSS Feed
- Permalink
04 Oct 2023 02:38 PM
Ok here is where I'm at. For 2 different connectors we switched the status from running to paused. It was tracking correctly in Dynatrace. Whenever it was running we would get a datapoint with value of 1, as expected from what you noted above.
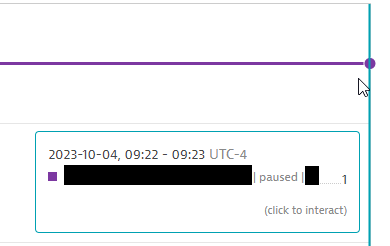
What is not working correctly (based off previous comments above) is the status dimension will still show the previous status, it does not get updated unless I upload a new version of the extension. The datapoint value is correct, it will drop to a 0 when it isn't running but it will still show a status of paused (we are testing by switching from paused to running then back to paused).
The example below is from when a connector was paused. We started it back up and as noted by the '1' it reflects as running (which was correct) but the status never changed, it only changes after updating a new version of the extension.
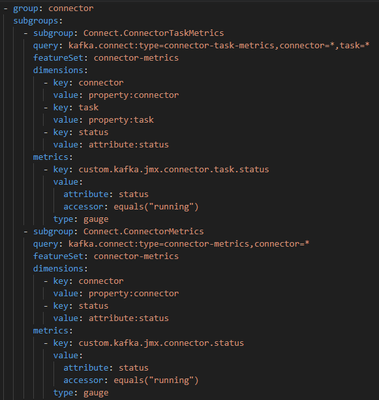
Here is the yaml. The first query is meant to capture the task status because that is what the use case is for, alert if a task hits failed state. The 2nd query is for the connector status which likely can be removed, i just left it in because we were originally looking at the connector status until the use case changed.
- Mark as New
- Subscribe to RSS Feed
- Permalink
04 Oct 2023 02:53 PM
@victor_balbuena i think until we get this dimension status tracking correctly this is not going to work for us. It's great that we have running connectors showing as 1 but we can't alert if below 1 because below 1 could be from the connector being paused or failed, we only care if the connector is failed.
Having the status dimension reflect the true status should allow us to alert for what we need.
- Mark as New
- Subscribe to RSS Feed
- Permalink
04 Oct 2023 03:17 PM
I undersand your pain but I'm not a support person, I'm just trying to help you because I happen to know about extensions and JMX 😄 I really thought what I mentioned above could work, because I'm as perplexed as you, I've never seen it happen before in any JMX extension in EF2.0. Maybe there is an underlying bug somewhere here...
- Mark as New
- Subscribe to RSS Feed
- Permalink
04 Oct 2023 03:35 PM
No worries @victor_balbuena! I appreciate all the time spent here. I think it is an improvement from what we have but still lacking some. I'm hoping our account reps can help us push this along to get more visibility on this, maybe from the extensions team.
- Mark as New
- Subscribe to RSS Feed
- Permalink
10 Oct 2023 01:20 PM
Ok, I finally got the answer for you after looking more and more into this. It's actually mentioned in the documentation, but seems like we both missed it. It states that using attributes as dimensions will only be captured once when the MBean is discovered and won't be updated. This is being worked on so it's improved for the future and we can use attributes as dimensions.
- Mark as New
- Subscribe to RSS Feed
- Permalink
11 Oct 2023 03:20 PM
Glad you found that so we at least know what is going on but it is also upsetting. It's essentially useless for us to only capture the status when it is discovered and instead each time the attribute is updated.
When you say this is being worked on do you know of an eta for that? Or an RFE / post I can follow to stay informed of this update?
- Mark as New
- Subscribe to RSS Feed
- Permalink
11 Oct 2023 03:26 PM
Only internally unfortunately, so feel free to open an RFE and I will vote for it as well
- Mark as New
- Subscribe to RSS Feed
- Permalink
11 Oct 2023 03:40 PM
Thank you! I have created the RFE below. Thanks a bunch for your time here.
Featured Posts


