This website uses Cookies. Click Accept to agree to our website's cookie use as described in our Privacy Policy. Click Preferences to customize your cookie settings.
Extensions
Turn on suggestions
Auto-suggest helps you quickly narrow down your search results by suggesting possible matches as you type.
- Community Home
- Platform
- Extensions
- Re: JMX Plugin: How can we get data from Object?
Options
- Subscribe to RSS Feed
- Mark Topic as New
- Mark Topic as Read
- Pin this Topic for Current User
- Printer Friendly Page
Options
- Mark as New
- Subscribe to RSS Feed
- Permalink
14 May 2019
01:55 AM
- last edited on
05 Jun 2025
02:31 PM
by
![]() MaciejNeumann
MaciejNeumann
Hi,
We are facing a problem to get some metrics from JMX.
We need to get and show the following value in Dashboards by JMX plugin.
java.lang:type=Memory => "used" of HeapMemoryUsage
This attribute reply values as Object that includes key/value sets like:
HeapMemoryUsage ->
{
    commited: 37867520,
    init: 30762048,
    max: 675086336,
    used: 25017808 <= We need this
}
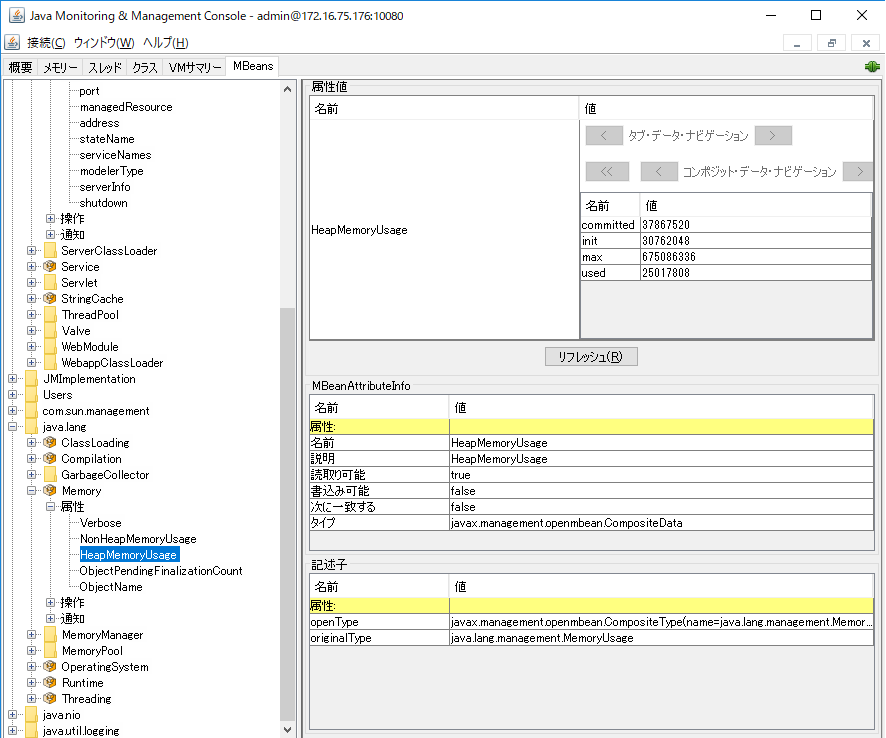
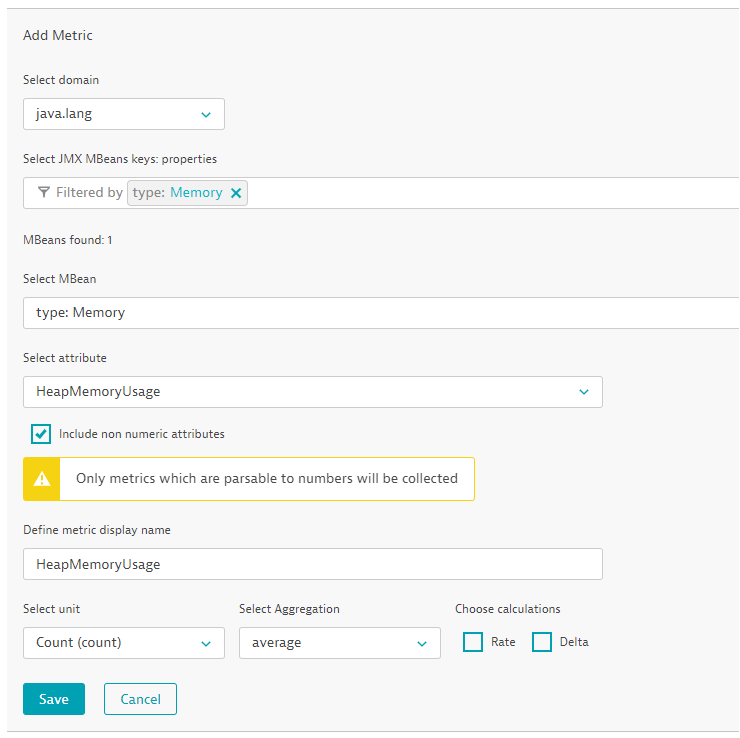
In the JMX plugin editor, we can find "java.lang" and "type:Memory" and "HeapMemoryUsage".
But we can not find "used" key in the plugin editor UI.
Could you tell me whether it is possible to get "used" value by JMX plugin?
Thanks,
Noah Kobayashi
Solved! Go to Solution.
Labels:
- Labels:
-
extensions
-
jmx
5 REPLIES 5
Options
- Mark as New
- Subscribe to RSS Feed
- Permalink
15 May 2019 04:22 PM
Hi.
Getting data from CompositeData Objects is tricky but not impossible.
Unfortunately it is not available by using JMX plugins editor.
You would have to edit plugin manually by downloading it and editing JSON file or just by writing one by yourself.
What you need to do is define metric that points to this exact MBean and attribute as you would for simple primitive type (for example save plugin that you created in editor, you will have base already defined and correct) but inside "source" section of that timeseries add line:
"attributePath": "get(\"used\")",
attributePath mechanism allows to perform methods that return numbers on Objects exposed as MBeans.
For example if attribute is a Map you can get its entry, or check collection size etc.
Reply
Options
- Mark as New
- Subscribe to RSS Feed
- Permalink
11 Jun 2019 12:54 PM
Hi,
Thank you for your answer.
I'm trying the "attributePath".
But I can't see the "used" value in the Further details screen.
Could you check my plugin.json?
{
  "version": "1.1560248397",
  "name": "custom.jmx.CreatedPlugin_SamplePlugin-1560248396428",
  "type": "JMX",
  "processTypes": [
    10,
    12,
    13,
    16,
    17,
    18
  ],
  "entity": "PROCESS_GROUP_INSTANCE",
  "configUI": {
    "displayName": "SamplePlugin"
  },
  "ui": {
    "charts": [
      {
        "group": "SamplePlugin metrics",
        "title": "Used of LastGcInfo/HeapMemoryUsage",
        "series": [
          {
            "key": "metric_LastGcInfo_1560248393979",
            "aggregation": "avg",
            "displayname": "Used of LastGcInfo/HeapMemoryUsage"
          }
        ]
      }
    ]
  },
  "metrics": [
    {
      "timeseries": {
        "key": "metric_LastGcInfo_1560248393979",
        "unit": "Byte",
        "displayname": "Used of LastGcInfo/HeapMemoryUsage",
        "dimensions": [
          "rx_pid"
        ]
      },
      "source": {
        "domain": "java.lang",
        "keyProperties": {
          "type": "GarbageCollector",
          "name": "MarkSweepCompact"
        },
        "attribute": "LastGcInfo",
        "allowAdditionalKeys": true,
        "calculateDelta": false,
        "calculateRate": false,
        "aggregation": "AVG",
        "attributePath": "get(\"used\")"
      }
    }
  ]
}
Thanks,
Noah Kobayashi
Options
- Mark as New
- Subscribe to RSS Feed
- Permalink
11 Jun 2019 01:58 PM
Hi.
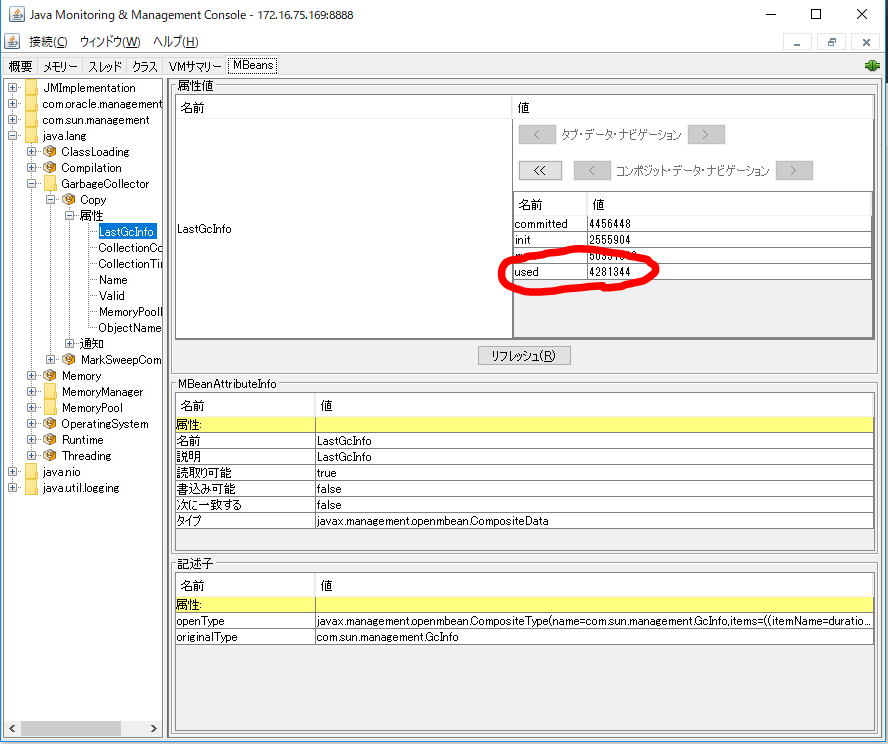
I can see in my JConsole that attribute": "LastGcInfo" differs from "HeapMemoryUsage", what is an attribute you where initially asking. It has its "used" value more hidden. It looks like it is inside "memoryUsageAfterGc" or "memoryUsageBeforeGc" and they point to yet another Map. To get values form nested Map you can use same mechanism. Try something like:
"attributePath": "get(\"memoryUsageBeforeGc\").get(\"used\")"
But first confirm in your JConsole that it is what you are looking for.
Best regards,
Sebastian Cichocki.
Options
- Mark as New
- Subscribe to RSS Feed
- Permalink
12 Jun 2019 10:02 AM
Thank you for your reply.
Getting data is succeeded!
However, the number got by the JMX plug-in does not match the number get by Jconsole.
There is no mistake in the attribute name (I Think).
Current target:
java.lang:type=GarbageCollector,name=Copy -> LastGCInfo -> MemoryUsageAfterGc -> used
Plugin.json:
  "metrics": [
    {
      "timeseries": {
        "key": "metric_LastGcInfo_1560248393979",
        "unit": "Count",
        "displayname": "Used of LastGcInfo/HeapMemoryUsage",
        "dimensions": [
          "rx_pid"
        ]
      },
      "source": {
        "domain": "java.lang",
        "keyProperties": {
          "type": "GarbageCollector",
          "name": "Copy"
        },
        "attribute": "LastGcInfo",
        "allowAdditionalKeys": true,
        "calculateDelta": false,
        "calculateRate": false,
        "aggregation": "AVG",
        "attributePath": "get(\"memoryUsageAfterGc\").get(\"value\").get(\"used\")"
      }
    }
Dynatrace says "33.8MB"
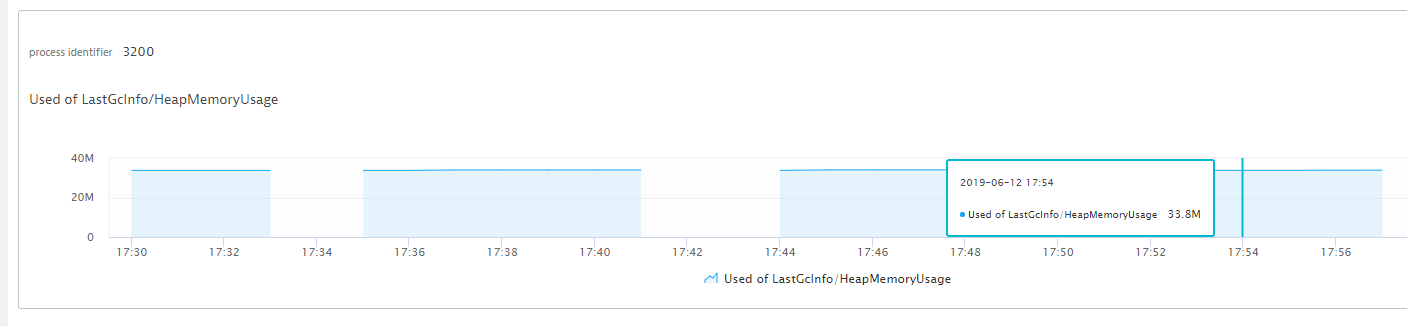
Jsoncole says "4281344"
Is there anything that can be considered as a cause?
Or should I open a support ticket?
Options
- Mark as New
- Subscribe to RSS Feed
- Permalink
18 Jun 2019 12:28 PM
Note that "memoryUsageAfterGc" is a map where you usually have six entries with different MemoryUsage object instance, each holding different "used" value.
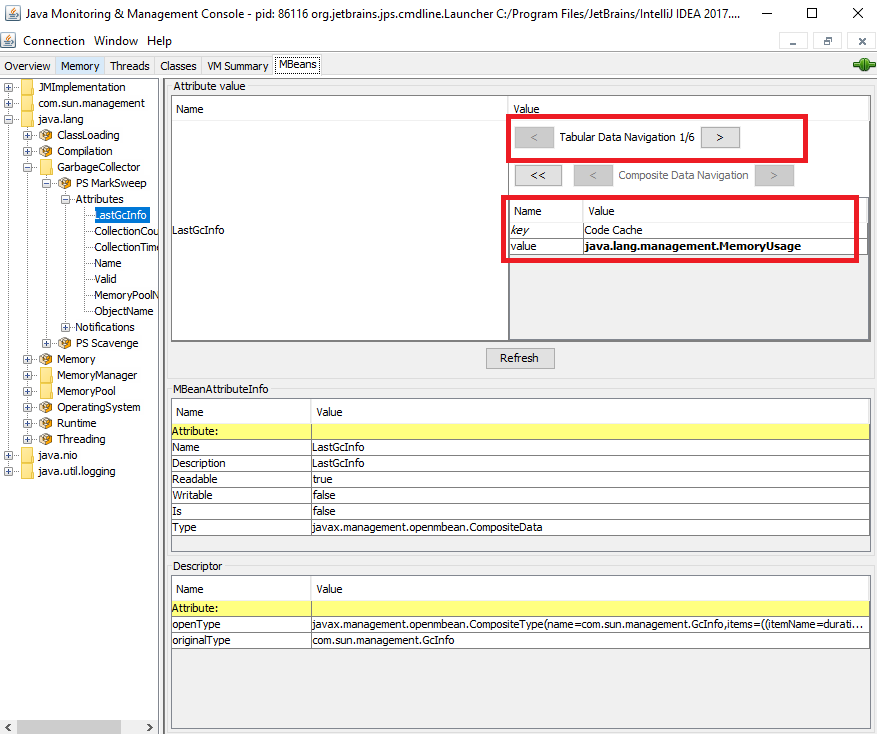
Your declaration states that you just get one "value" right out from "memoryUsageAfterGc" object. It seems that you get something random or aggregated. To have exactly same value as in your screenshot you have to point exact method that will go deeper to single object from that map. It is heavily wrapped, look how complex descriptor of that field looks like:
(itemName=memoryUsageAfterGc,itemType=javax.management.openmbean.TabularType(name=java.util.Map<java.lang.String, java.lang.management.MemoryUsage>,rowType=javax.management.openmbean.CompositeType(name=java.util.Map<java.lang.String, java.lang.management.MemoryUsage>,items=((itemName=key,itemType=javax.management.openmbean.SimpleType(name=java.lang.String)),(itemName=value,itemType=javax.management.openmbean.CompositeType(name=java.lang.management.MemoryUsage,items=((itemName=committed,itemType=javax.management.openmbean.SimpleType(name=java.lang.Long)),(itemName=init,itemType=javax.management.openmbean.SimpleType(name=java.lang.Long)),(itemName=max,itemType=javax.management.openmbean.SimpleType(name=java.lang.Long)),(itemName=used,itemType=javax.management.openmbean.SimpleType(name=java.lang.Long))))))),indexNames=(key))),(itemName=startTime,itemType=javax.management.openmbean.SimpleType(name=java.lang.Long)))
Here you have dump of that map obtained by different JMX browser:
memoryUsageAfterGc": {

      "PS Eden Space": {

        "init": 134742016,

        "committed": 134742016,

        "max": 2810183680,

        "used": 0

      },

      "Code Cache": {

        "init": 2555904,

        "committed": 6422528,

        "max": 251658240,

        "used": 6329472

      },

      "Compressed Class Space": {

        "init": 0,

        "committed": 2752512,

        "max": 1073741824,

        "used": 2586032

      },

      "PS Survivor Space": {

        "init": 22020096,

        "committed": 22020096,

        "max": 22020096,

        "used": 0

      },

      "PS Old Gen": {

        "init": 358088704,

        "committed": 147849216,

        "max": 5708447744,

        "used": 12848888

      },

      "Metaspace": {

        "init": 0,

        "committed": 21807104,

        "max": -1,

        "used": 21277544
      }
}Featured Posts
