- Dynatrace Community
- Ask
- Extensions
- Problems with self.find_single_process_group in custom OneAgent plugin
- Subscribe to RSS Feed
- Mark Topic as New
- Mark Topic as Read
- Pin this Topic for Current User
- Printer Friendly Page
- Mark as New
- Subscribe to RSS Feed
- Permalink
09 Oct 2019
01:37 PM
- last edited on
18 May 2023
04:00 PM
by
![]() Michal_Gebacki
Michal_Gebacki
Good morning all!
I am teaching myself to build a custom plugin and so far so good. It's been fun and frustrating all at the same time 🙂 I am determined however I am currently stuck and hoping another developer out there can give me some insight to figure out what I am doing wrong.
This is a OneAgent plugin in Python on a Linux host to be clear. I am trying to get my plugin to look for a process to #1 ensure it's running before attempting to grab metrics and #2 to obtain the path of where that process is running from. Looking at TONS of other plugins out there which are helping me to learn allot, it appeared that the following should do it:
try:
pgi = self.find_single_process_group(pgi_name('tibemsd64'))
Yet this does not seem to be the case or at least I think. When I look at the OneAgent plugin log "pluginDevLoggerPluginEngineDefault.log" I can see it's trying, but always comes back with:
File "/opt/dynatrace/oneagent/agent/plugin/engine/ruxit/api/base_plugin.py", line 112, in find_single_process_group
raise ConfigException("Expected exactly 1 pgi to match predicate found: %s" % len(ret))
ruxit.api.exceptions.ConfigException: Expected exactly 1 pgi to match predicate found: 0
Which if I am reading that correctly, means it is not finding that process. Yet if I do a grep for that process on the host, it is in fact clearly there.
ps -ef | grep tibemsd64
xxxxxx 1663 1 8 Oct08 ? 02:08:33 /lcl/sit/apps/tibco/ems/8.4/bin/tibemsd64
I have been trying to figure out how to get the plugin to provide more details on exactly what it is getting back from the OS doing the following:
try:
pgi = self.find_single_process_group(pgi_name('tibemsd64'))
except ConfigException as e:
raise ConfigException('Can not find the path to tibemsd64: {pgi} {e}')
This however did not work either.
I would really appreciate some pointers on what I might be doing wrong and what I can do to maybe get more information on what is going on behind the scene.
Thank you
Solved! Go to Solution.
- Labels:
-
extensions
-
oneagent
- Mark as New
- Subscribe to RSS Feed
- Permalink
09 Oct 2019 01:40 PM
Just a quick check, is the process group instance in Dynatrace also called tibemsd64? pgi is not the process name on the server, but the name used within the Dynatrace UI.
- Mark as New
- Subscribe to RSS Feed
- Permalink
09 Oct 2019 01:47 PM
AH! I was thinking it was the process name on the host. That explains allot!
Thank you SO MUCH! I have been trying for 2 days to figure this out with no luck at all.
- Mark as New
- Subscribe to RSS Feed
- Permalink
09 Oct 2019 01:54 PM
Let me know if it worked 🙂
- Mark as New
- Subscribe to RSS Feed
- Permalink
09 Oct 2019 03:19 PM
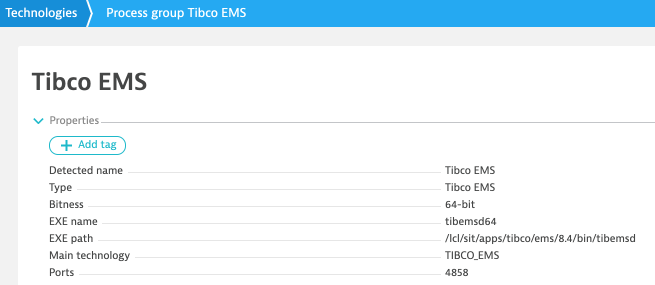
Well I changed the tibemsd64 to the process group name as detected in Dynatrace which is "Tibco EMS"...

class TibcoEMSPlugin(BasePlugin):
    def query(self, **kwargs):
        config  =  kwargs['config']

        url = config['url']
        user = config['user']
        password = config['password']
        pgi = None

        try:
            pgi = self.find_single_process_group(pgi_name('Tibco EMS'))
        except ConfigException:
            raise ConfigException('Error 1')
The pluginDevLoggerPluginEngineDefault.log shows...
  File "/opt/dynatrace/oneagent/agent/plugin/python3.6/subprocess.py", line 1344, in _execute_child
    raise child_exception_type(errno_num, err_msg, err_filename)
FileNotFoundError: [Errno 2] No such file or directory: '/tibemsadmin': '/tibemsadmin'
Really lost on why it says "No such file or directory: '/tibemsadmin'. It's as if it is not picking up the path. The tibemsadmin is clearly there and in the same directory as the Process Group.

Any ideas? Thank you for the help.
- Mark as New
- Subscribe to RSS Feed
- Permalink
09 Oct 2019 04:12 PM
I'll reach out over email so you can send the log files, then we can update this case once it is resolved.
- Mark as New
- Subscribe to RSS Feed
- Permalink
11 Oct 2019 02:59 PM
The problem was resolved by using the Dynatrace processgroup instance name instead of the OS process name.
The subsequent unrelated problems were solved as well, but that's not related to the issue.
Mike
- Mark as New
- Subscribe to RSS Feed
- Permalink
11 Oct 2019 03:03 PM
Yes, Thank you @Michael L. - You were a HUGE help. Very much appreciated!
- Mark as New
- Subscribe to RSS Feed
- Permalink
24 Oct 2019 09:41 AM
Hey @Larry R., What metric group did you use in your plugin.json?
"metricGroup"
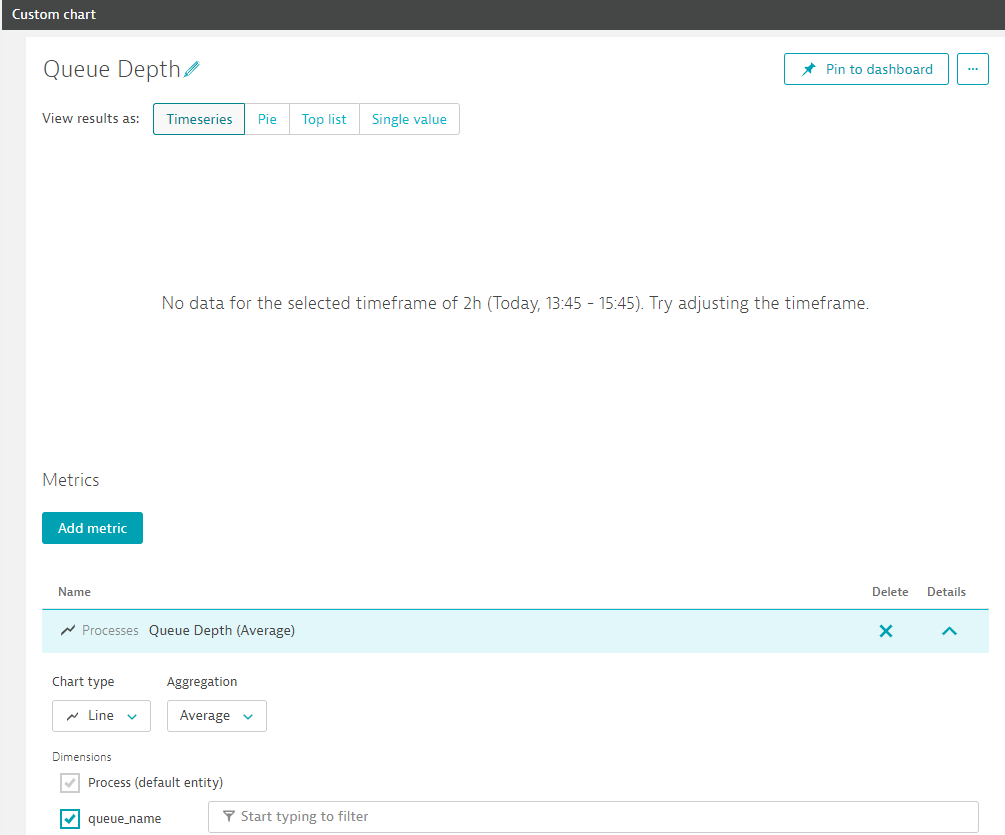
I can see the metric group I created under metrics for my custom chart but there is never any data, even though when I run the plugin simulator it returns a queue with at least 500 messages on it...
I also do not see anything in the logs ... /opt/dynatrace/oneagent/log/plugin/pluginDevLoggerOsAgentDefault.log
The logfile you mentioned in your initial post doesn't exist in my directory. Im using the latest version of the oneagent version 1.177.216
- Mark as New
- Subscribe to RSS Feed
- Permalink
24 Oct 2019 02:14 PM
Good morning! I used...
"metricGroup": "TibcoEMS"
The log path would be (Linux)...
/opt/dynatrace/oneagent/log/plugin
Within that path you should see a new log file which gets created called ruxitagent_pluginagent_<DIFFERENT NUMBERS>.log
Each time you create a new build, the OneAgent will start a new log. I would recommend just looking at the path and then as you are testing, examine the timestamps for the logs so you know which ones to look at specifically. At least, this is how I did it anyway 🙂
- Mark as New
- Subscribe to RSS Feed
- Permalink
24 Oct 2019 02:37 PM
Thanks, tailing the logs , I cant see the plugin fireing just the docker and python heartbeat plugins. My metric group was TibcoEMS anyway.. it's odd


This is not my first plugin I've deployed .... I think I'll wait for you to share your code...:-)
- Mark as New
- Subscribe to RSS Feed
- Permalink
25 Oct 2019 05:25 AM
@Larry R., Hi, I managed to figure it out... I was using the command line with a custom deployment directory -d argument when building the plugin, somehow dynatrace doesn't register the plugin correctly when doing this or I did not copy all the files into the plugin_deployment directory (I use custom directories, for CI pipelines with Jenkins builds for plugins) I used the defaults and my plugin now fires and works as expected. We can compare notes when you share your plugin. 🙂
- Mark as New
- Subscribe to RSS Feed
- Permalink
25 Oct 2019 01:18 PM
Good deal. Glad you got it working!
- Mark as New
- Subscribe to RSS Feed
- Permalink
25 Oct 2019 08:43 PM
Thanks Larry, keep up the good work..!!
Featured Posts
