This website uses Cookies. Click Accept to agree to our website's cookie use as described in our Privacy Policy. Click Preferences to customize your cookie settings.
Open Q&A
If there's no good subforum for your question - ask it here!
Turn on suggestions
Auto-suggest helps you quickly narrow down your search results by suggesting possible matches as you type.
- Community Home
- Platform
- Open Q&A
- Re: Configuration of java hung thread
Options
- Subscribe to RSS Feed
- Mark Topic as New
- Mark Topic as Read
- Pin this Topic for Current User
- Printer Friendly Page
Options
- Mark as New
- Subscribe to RSS Feed
- Permalink
05 Nov 2018 04:10 PM
How can i configure the alert for the java hung thread in DT? I dont see any option in custom alert as well.
Solved! Go to Solution.
Labels:
- Labels:
-
java
8 REPLIES 8
Options
- Mark as New
- Subscribe to RSS Feed
- Permalink
06 Nov 2018 09:45 AM
Per default there is no metric for hung threads.
But uou could add a "hung threads" metric via a JMX Plugin.
Dynatrace Certified Master - Dynatrace Partner - 360Performance.net
Options
- Mark as New
- Subscribe to RSS Feed
- Permalink
06 Nov 2018 10:29 AM
thanks patrick.
While uploading the pulgin under custon plugin, i hope we have to select "One Agent Plugin" right not the "Activegate plugin"
Options
- Mark as New
- Subscribe to RSS Feed
- Permalink
06 Nov 2018 01:19 PM
Correct it is a OneAgent Plugin
Dynatrace Certified Master - Dynatrace Partner - 360Performance.net
Options
- Mark as New
- Subscribe to RSS Feed
- Permalink
03 Feb 2020 11:46 AM
Hello @Patrick H. @Julius L. @Sebastian K.
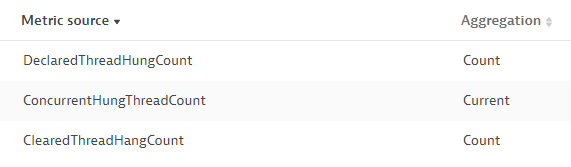
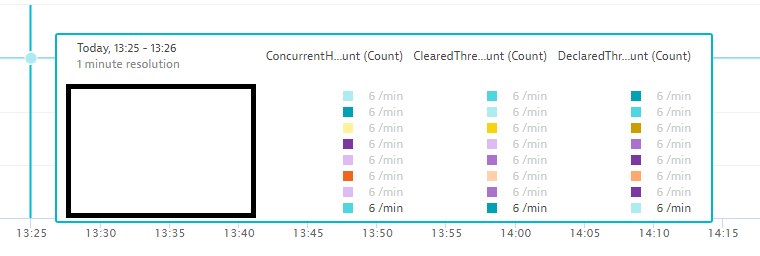
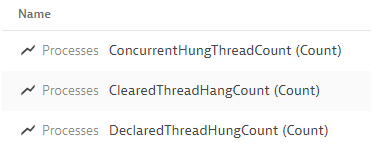
I added the following JMX metrics, and since that time, I can see that there is a constant number 6 for all of them.
Do you think that I did some mistakes while adding metrics?
Regards,
Babar
1580729972343.png
11 KB
Reply
Options
- Mark as New
- Subscribe to RSS Feed
- Permalink
27 Feb 2020 07:47 PM
Can you check the values using jconsole or jmxterm?
Dynatrace Ambassador | Alanata a.s., Slovakia, Dynatrace Master Partner
Options
- Mark as New
- Subscribe to RSS Feed
- Permalink
09 Mar 2022 06:01 PM
I don't know if this is still an issue for you but I found that using the "average" aggregation gave me the correct values for declared hung and concurrent hung in my dashboard tiles. Hope that helps!
Options
- Mark as New
- Subscribe to RSS Feed
- Permalink
06 Nov 2018 10:36 AM
Hello,
There's no such metric in DT.
You can create an alert based on Websphere Log.
You could have this kind of error :
WSVR0605W:
Thread “WebContainer : 1” has been active for 612,000 milliseconds and
may be hung. There are 3 threads in total in the server that may be
hung.
Regards,
Mathieu
Options
- Mark as New
- Subscribe to RSS Feed
- Permalink
06 Nov 2018 10:45 AM
Hello,
But i dont see metric to create a alert for hung thread.
Regards,
Manish Bachu
Featured Posts
