- Dynatrace Community
- Ask
- Open Q&A
- Connection pool metric in weblogic
- Subscribe to RSS Feed
- Mark Topic as New
- Mark Topic as Read
- Pin this Topic for Current User
- Printer Friendly Page
- Mark as New
- Subscribe to RSS Feed
- Permalink
09 Jun 2021
12:08 PM
- last edited on
10 Jun 2021
08:45 AM
by
![]() MaciejNeumann
MaciejNeumann
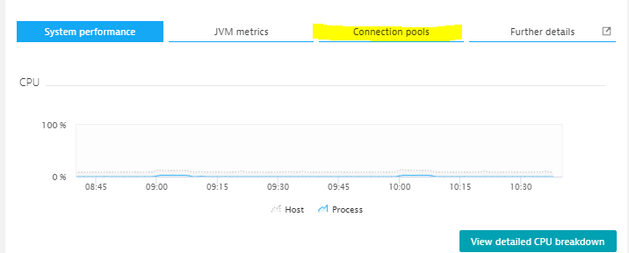
The environment I currently monitor is using Web logic, which is connected to Oracle DB later. I found that some Weblogic has "Connection pool" indicators, and some do not.
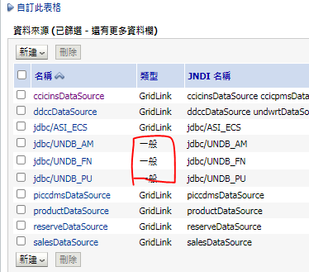
I am thinking, is it related to the "connection type"? Because there will be a "connection pool" indicator when using "normal" connection, but not when using "GribLink".
I wonder if you have ever encountered such a situation?
Is there any other way to get the "connection pool" indicator?
Thank you,
Owen
Solved! Go to Solution.
- Mark as New
- Subscribe to RSS Feed
- Permalink
09 Jun 2021 05:39 PM
Please check if Weblogic is exposing this data through JMX. In the Properties section of the process, you should be able to see in the JVM parameters if it is there or not.
Additionally, to see more details, click on "Further details" and you should be able to see details about each connection pool.
- Mark as New
- Subscribe to RSS Feed
- Permalink
11 Jun 2021 04:24 AM
Thank you @AntonioSousa .
I later found a custom to join JMX, and added related metrics.
Featured Posts


