- Dynatrace Community
- Ask
- Open Q&A
- Define chart to show java runtime memory per host
- Subscribe to RSS Feed
- Mark Topic as New
- Mark Topic as Read
- Pin this Topic for Current User
- Printer Friendly Page
- Mark as New
- Subscribe to RSS Feed
- Permalink
10 Sep 2021
02:37 PM
- last edited on
28 Sep 2022
10:27 AM
by
![]() MaciejNeumann
MaciejNeumann
Hi,
I'm searching a solution to show in a chart, table, or dashboard .... anyway
to show java runtime memory size and hostname where the process is running.
In the same screen.
The process is same on each host so Dynatrace create a unique process group.
In chart i can see memory size for each instance of process named by process group but I can't see hostname.
I tried renaming process group to create several process group named by hostname I use a rule tag based where I named a specific tag with hostname , but Dynatrace use only the first rule so my chart show the same process group name for each instance of process.
Is there any solution?
Thanks
Olivier
Solved! Go to Solution.
- Labels:
-
hosts classic
-
java
- Mark as New
- Subscribe to RSS Feed
- Permalink
17 Sep 2021 09:27 PM
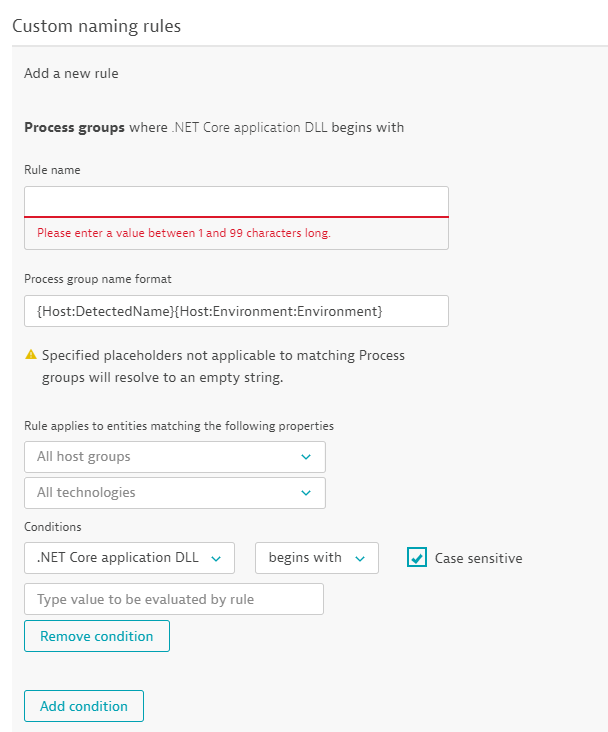
What we did was set a process naming rule that adds in the <HostName>-<Environment> and then the process name. That way the Process is named: Host 1 - DV1 - securityscan. Then all problems and charting are pretty explicit as to where its coming from and what it is. You can also add in Application name and such. The possibilities are up to you!
Featured Posts

