This website uses Cookies. Click Accept to agree to our website's cookie use as described in our Privacy Policy. Click Preferences to customize your cookie settings.
Open Q&A
If there's no good subforum for your question - ask it here!
Turn on suggestions
Auto-suggest helps you quickly narrow down your search results by suggesting possible matches as you type.
- Community Home
- Platform
- Open Q&A
- Does Dynatrace support service level monitoring in Datapower?
Options
- Subscribe to RSS Feed
- Mark Topic as New
- Mark Topic as Read
- Pin this Topic for Current User
- Printer Friendly Page
Options
- Mark as New
- Subscribe to RSS Feed
- Permalink
07 Mar 2019
02:25 PM
- last edited on
17 Apr 2023
10:08 AM
by
![]() MaciejNeumann
MaciejNeumann
Does Dynatrace support service level monitoring in Datapower?
Solved! Go to Solution.
Labels:
- Labels:
-
services classic
-
technologies
12 REPLIES 12
Options
- Mark as New
- Subscribe to RSS Feed
- Permalink
07 Mar 2019 03:22 PM
Hi Lohit,
Dynatrace does not support service level monitoring for Datapower like the OneAgent provides for other supported technologies. There is the Datapower plugin that gives insight into some Datapower metrics and can show the Datapower instances as proxy devices in the service flow. See more on the Datapower plugin here.
Thanks
NJ
Reply
Options
- Mark as New
- Subscribe to RSS Feed
- Permalink
08 Mar 2019 07:30 AM
Hi @Lohit R.
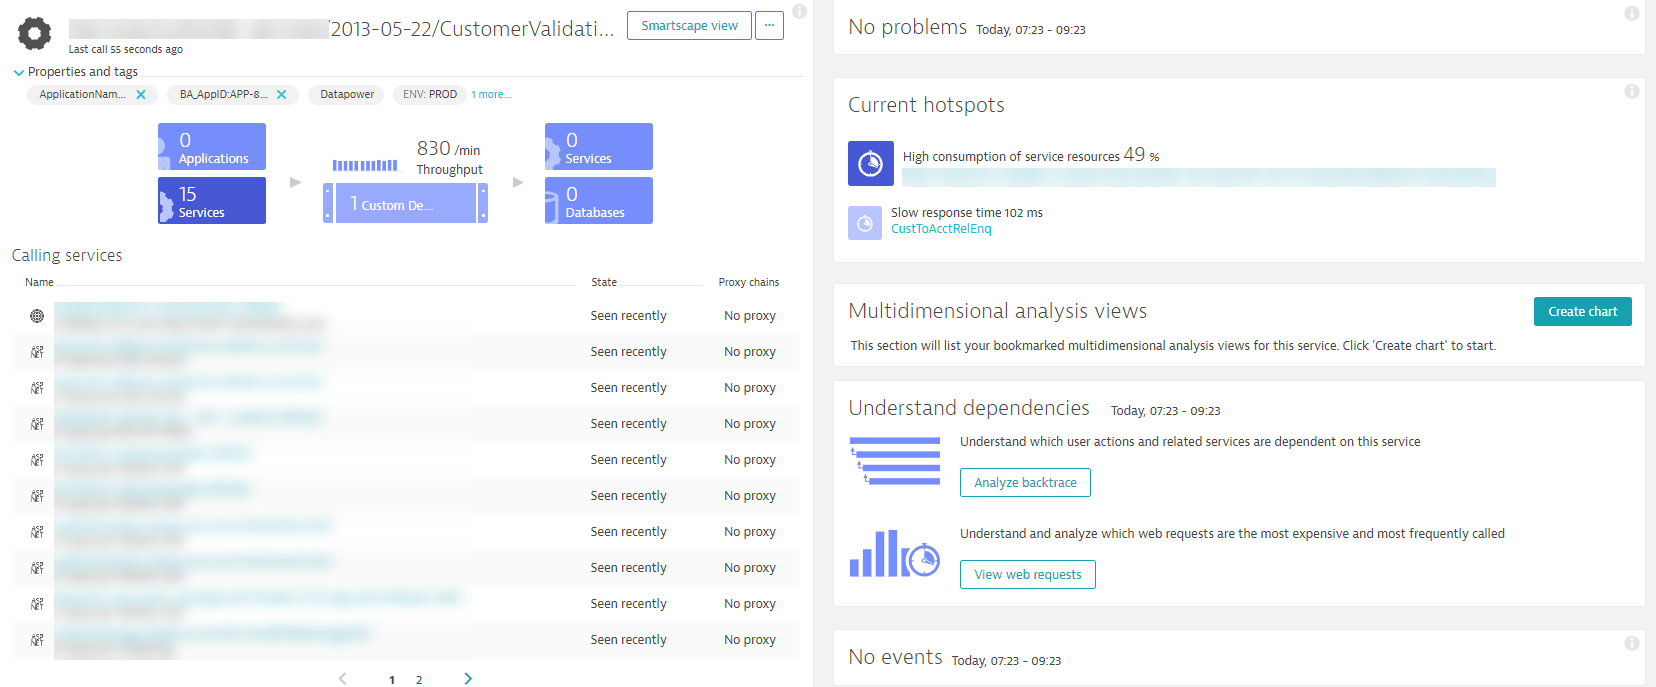
I am not 100% sure your exactly requirement, but after the DataPower plugin was configured in our environment, we were able to pick up each of the DataPower Services as a service in Dynatrace. This would then allow us to alert on these services if we add the necessary tags to the Service.
Please see this screenshot, is this what you are looking for?
Options
- Mark as New
- Subscribe to RSS Feed
- Permalink
08 Mar 2019 11:01 AM
Hi! @Barry L.
Can you expand in "we were able to pick up each of the DataPower Services as a service in Dynatrace" i would assume that you see it like a "proxy" kind of thing? No insight but you see that the purepath have it in the chain of service?
and what did you mean by "if we add the necessary tags to the Service".
Thanks in advance.
Services Solution Engineer @PowerCloud - Observability/CloudOps Certified / Former SE @Dynatrace.
Options
- Mark as New
- Subscribe to RSS Feed
- Permalink
08 Mar 2019 11:31 AM
Hi @Dante P.
Previously we had all these services going to Unmonitored hosts and now we can see the individual services per Datapower service operation.
After we configured a single DataPower device on our environment, we were able to see the DataPower metrics in the technology stack.
This then also gave an IP to the other services as a reference to the DataPower devices we have in the environment and the Dynatrace agent then automagically registered and knew that our services are speaking to the DataPower.
If you have other OneAgents in full stack mode and they are making calls to DataPower, each of the service operations that is being called in the Datapower are now listed as a web service. Each service like the screenshot above then gives you the other services speaking too it.
From a proxy perspective, that is not in place as yet in our environment as we still have the MQ, IIB and F5 bits after the DataPower that is supposed to link the DataPower to the other Services.
What I mean by the adding of necessary tags...that is from an alerting perspective, I can now alert on the DataPower service having errors or slow response by adding tags to the "service". Adding a tag to say that a datapower operation has a tag named TeamA, we can then in the alerting profile create a profile where the Tag is TeamA and when that occurs, they will then be alerted via the Problem notification/integration.
Hope this is sufficient.
Regards
Barry
Reply
Options
- Mark as New
- Subscribe to RSS Feed
- Permalink
08 Mar 2019 01:19 PM
@Barry L. Oh! i see, in our deployment datapower is like an internal etl where services are calling but most of the time also being call. Per your screenshot i see that is not "detecting" any outgoing call. When you say "Datapower Services" you mean the webservice?
One last thing if i may, your datapower is a "Datapower Gateway"? if so, witch version?
Services Solution Engineer @PowerCloud - Observability/CloudOps Certified / Former SE @Dynatrace.
Options
- Mark as New
- Subscribe to RSS Feed
- Permalink
05 Apr 2023 01:08 PM
Hello Guys,
Sorry to wakeup you after all those years,
what are the steps to discover the Data power services, Im using the extension, but the only thing that I have are metrics for Dashboard.
Thanks in advance for your clarification.
Sharing Knowledge
Options
- Mark as New
- Subscribe to RSS Feed
- Permalink
13 Apr 2023 04:12 PM
Hello Guys,
We have also facing the same issue where we are not able to see services which are running on data power devices. Is there a way we can discover these services?
I found this blog post where I am able to see services which are running on data power devices..
Introducing the DataPower ActiveGate monitoring plugin | Dynatrace news
Thanks in advance
Options
- Mark as New
- Subscribe to RSS Feed
- Permalink
15 Apr 2023 10:15 PM
@vishal_shenduri @Malaik you will see services on top of DataPower devices created by te ActiveGate extension if there are requests coming from OneAgent monitored processes to the DataPower devices and there is match on IP address. So basically those services are detected from the caller side, not from Datapower itself.
Dynatrace Ambassador | Alanata a.s., Slovakia, Dynatrace Master Partner
Options
- Mark as New
- Subscribe to RSS Feed
- Permalink
16 Apr 2023 11:12 AM
Thanks @Julius_Loman
Could you please share with us some of screenshots/steps how to find those services?
Sharing Knowledge
Options
- Mark as New
- Subscribe to RSS Feed
- Permalink
16 Apr 2023 03:43 PM
As I wrote - it is being detected from the calling service if:
- the calling service is monitored by OneAgent
- protcol is one of the supported (such as HTTP/HTTPS)
- there is match on IP address between what the calling service sees when calling and the Data Power device (IP present in Dynatrace).
All from the above must be true in your case to see the service. If you don't see it, probably you either don't have calling side instrumented or there is something between the calling side and DataPower (reverse proxy for example).
Dynatrace Ambassador | Alanata a.s., Slovakia, Dynatrace Master Partner
Options
- Mark as New
- Subscribe to RSS Feed
- Permalink
05 May 2023 06:52 PM
Do you have a link or site where we could find that complete information? It seems that what you said is correct but we haven't found that requisites and our DP dyna extension only shows 10 services of about 300 that we have configured in our DP. is there a workaround?
Options
- Mark as New
- Subscribe to RSS Feed
- Permalink
05 May 2023 08:49 PM
No, basically I think there is nothing you can do about it. I'd recommend looking at traces which should call a datapower service. You should look of there is a request to unmonitored host and check the metadata of the request - hostname, IP addresses, etc and compare it to the device. There can be many reasons such as NAT which disallow creating those opaque services.
Dynatrace Ambassador | Alanata a.s., Slovakia, Dynatrace Master Partner
Featured Posts
