This website uses Cookies. Click Accept to agree to our website's cookie use as described in our Privacy Policy. Click Preferences to customize your cookie settings.
Open Q&A
If there's no good subforum for your question - ask it here!
Turn on suggestions
Auto-suggest helps you quickly narrow down your search results by suggesting possible matches as you type.
- Community Home
- Platform
- Open Q&A
- How to Monitor Java Threadpool Count (Similar to /ui/apps/dynatrace.classic.profiling/ui/diagnostictools/PROCESS_GROUP_INSTANCE-XX
Options
- Subscribe to RSS Feed
- Mark Topic as New
- Mark Topic as Read
- Pin this Topic for Current User
- Printer Friendly Page
Options
- Mark as New
- Subscribe to RSS Feed
- Permalink
25 Apr 2025
01:54 PM
- last edited on
28 Apr 2025
07:25 AM
by
![]() MaciejNeumann
MaciejNeumann
Hello,
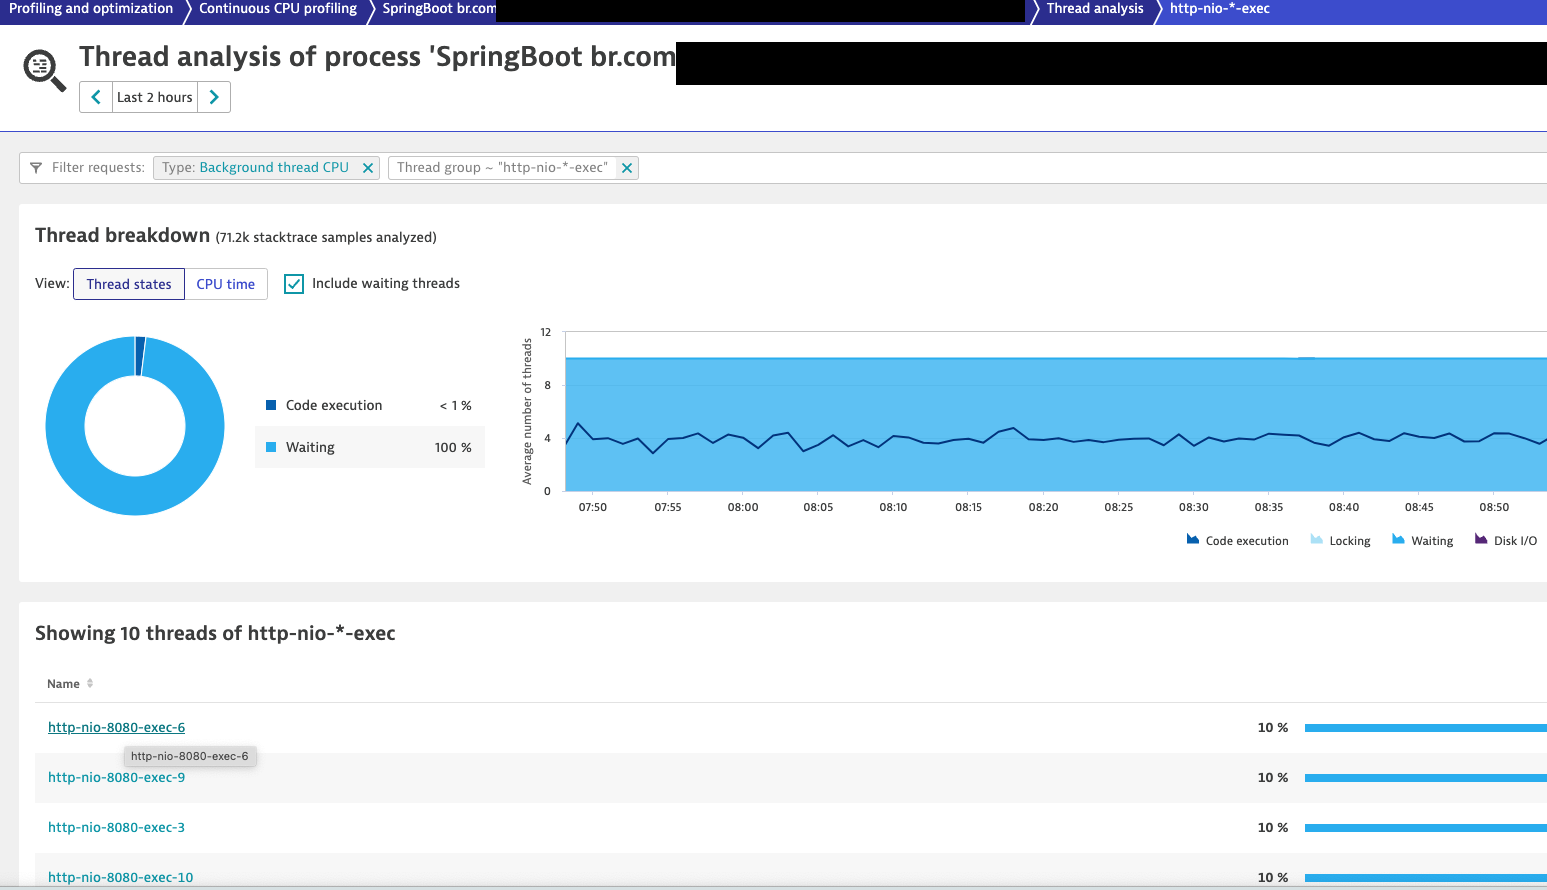
I need guidance on how to monitor and visualize the number of threads in a Java threadpool directly within Dynatrace. Ideally, I would like to achieve something similar to the Threadpool Count information displayed at the following path:
/ui/apps/dynatrace.classic.profiling/ui/diagnostictools/PROCESS_GROUP_INSTANCE-XXXX

This type of metric is critical for identifying performance bottlenecks and ensuring the health of Java applications.
Could someone please guide me on how to implement this? Is there a native way to achieve it, or would it require custom metrics or additional configurations?
Thank you for your assistance!
Solved! Go to Solution.
dynatrace-profiling.png
112 KB
1 REPLY 1
Options
- Mark as New
- Subscribe to RSS Feed
- Permalink
28 Apr 2025 07:26 AM
hi @michelsantos10,
We have the inbuilt metrics to get the Thread count for the process level.

If this is not the one you are looking then, please check the Extensions which can be used as per the technology such as Tomcat, Weblogic, WebSphere or any other JVM based setups.
If none of this gives you the expected solution, you can use the Custom JMX extension to build your own. And the only thing you should know is, MBean package and the metric.
JMX extensions — Dynatrace Docs
Thanks
aravind
Reply
Featured Posts
