- Dynatrace Community
- Dynatrace
- Ask
- Open Q&A
- Re: Services vs Number of Problems (For all induvial Services in the Management Zone)
- Subscribe to RSS Feed
- Mark Topic as New
- Mark Topic as Read
- Pin this Topic for Current User
- Printer Friendly Page
How to display the list of individual services in the management zone with the number of problems involving them?
- Mark as New
- Subscribe to RSS Feed
- Permalink
03 Oct 2022
09:16 AM
- last edited on
03 Oct 2022
10:25 AM
by
![]() Ana_Kuzmenchuk
Ana_Kuzmenchuk
Hi All,
I would like to display the list of services with number of problems it was part of.
for Example, When I select a management zone, I would like to see Services(Col 1) & Number of Problems(Col2).
Is there any way to achieve this?
The idea was the application team can work on the most problematic services.
We can do it manually for limited number of services which I have already achieved through placing the filtered problem tile into the dashboard. but we have 1000 of services where can't relay on this manual configurations.
Thanks,
Easwaran
Easwaran
- Labels:
-
dashboards classic
- Mark as New
- Subscribe to RSS Feed
- Permalink
03 Oct 2022 10:11 AM
Hi @Easwaran,
You can use the enviroment API V2 to create such table.
Problems API v2 - GET problems details | Dynatrace Docs
Example response:
{
"startTime": 0,
"endTime": 0,
"severityLevel": "AVAILABILITY",
"entityTags": [
{
"stringRepresentation": "string",
"value": "string",
"key": "string",
"context": "string"
}
],
"managementZones": [
{
"name": "string",
"id": "string"
}
],
"problemId": "string",
"displayId": "string",
"problemFilters": [
{
"name": "string",
"id": "string"
}
],
"rootCauseEntity": {
"entityId": {
"id": "string",
"type": "string"
},
"name": "string"
},
"evidenceDetails": {
"details": [
{
"evidenceType": "AVAILABILITY_EVIDENCE",
"displayName": "string",
"entity": {
"entityId": {
"id": "string",
"type": "string"
},
"name": "string"
},
"groupingEntity": {
"entityId": {
"id": "string",
"type": "string"
},
"name": "string"
},
"rootCauseRelevant": true,
"startTime": 0
}
],
"totalCount": 0
},
"impactAnalysis": {
"impacts": [
{
"impactType": "APPLICATION",
"impactedEntity": {
"entityId": {
"id": "string",
"type": "string"
},
"name": "string"
},
"estimatedAffectedUsers": 0
}
]
},
"recentComments": {
"comments": [
{
"authorName": "string",
"createdAtTimestamp": 0,
"context": "string",
"id": "string",
"content": "string"
}
],
"pageSize": 0,
"totalCount": 0,
"nextPageKey": "AQAAABQBAAAABQ=="
},
"impactLevel": "APPLICATION",
"affectedEntities": [
{
"entityId": {
"id": "string",
"type": "string"
},
"name": "string"
}
],
"linkedProblemInfo": {
"problemId": "string",
"displayId": "string"
},
"impactedEntities": [
{
"entityId": {
"id": "string",
"type": "string"
},
"name": "string"
}
],
"title": "string",
"status": "CLOSED"
}
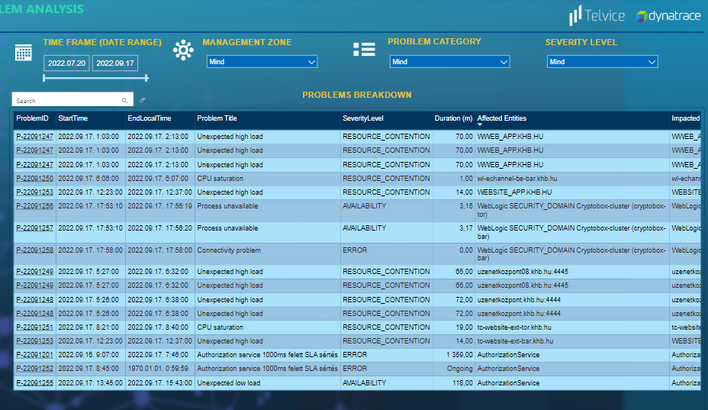
This is a PowerBI solution with Dynatrace Problem data via Problem APi v2.
I hope it helps.
Br, Mizső
- Mark as New
- Subscribe to RSS Feed
- Permalink
03 Oct 2022 12:06 PM
Hi Mizso,
Thanks for your suggestions above, but I am expecting the simple 2 columns with "Service Name" ,"Problem Count" within the Dynatrace itself using explorer or Custom Metrics or any solution without external reporting dependencies.
Thanks,
Easwaran M
Easwaran

