- Dynatrace Community
- Ask
- Open Q&A
- How to find the Top slow queries using OneAgent based on filtering both "Total Executions" and "Response Time Median" criteria at same time ?
- Subscribe to RSS Feed
- Mark Topic as New
- Mark Topic as Read
- Pin this Topic for Current User
- Printer Friendly Page
- Mark as New
- Subscribe to RSS Feed
- Permalink
10 Sep 2018
08:47 AM
- last edited on
09 Dec 2021
03:19 PM
by
![]() MaciejNeumann
MaciejNeumann
Hi ,
We are using Dynatrace OneAgent with default configuration to monitor one of the .Net application.
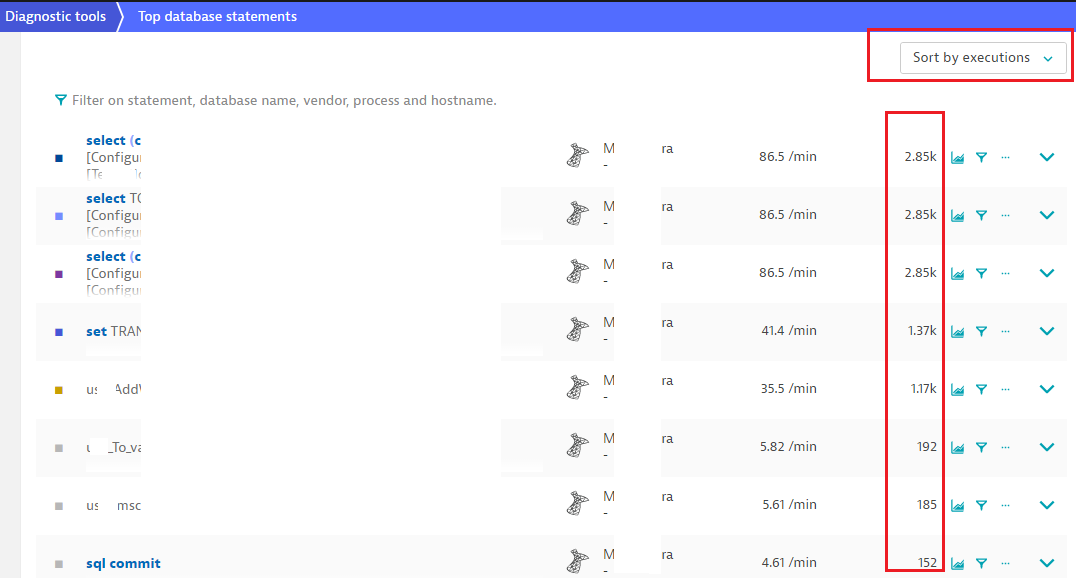
We want to extract the top slow queries based on both No. of executions and response time i.e we want both the "Total Executions" and "Response Time Median" column in same page and we want to save the Top slow queries details as reports (excel,PDF etc).

Kindly suggest if we can display the Top slow queries based on above two criteria(both "Total Executions" and "Response Time Median" at same time) and share it in Excel or PDF format.
Regards
Balaji
Solved! Go to Solution.
- Labels:
-
dotnet
-
profiling and optimization
- Mark as New
- Subscribe to RSS Feed
- Permalink
15 Jul 2020 03:44 PM
I would recompensed using the multidimensional analysis chart - this will allow you to include multiple variables into a single chart. Let me know if you need any assistance with it!
Featured Posts
