- Dynatrace Community
- Ask
- Open Q&A
- Is it possible monitor load test traffic (JMeter) in Dynatrace via Agentless ?
- Subscribe to RSS Feed
- Mark Topic as New
- Mark Topic as Read
- Pin this Topic for Current User
- Printer Friendly Page
- Mark as New
- Subscribe to RSS Feed
- Permalink
25 Jul 2022
11:05 AM
- last edited on
11 Aug 2022
09:41 AM
by
![]() MaciejNeumann
MaciejNeumann
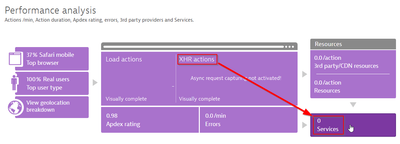
I've used JMeter load each XHR of my website (Dynatrace Agentless) but I can't see traffic in each default visualization.
Solved! Go to Solution.
- Labels:
-
jmeter
-
services classic
- Mark as New
- Subscribe to RSS Feed
- Permalink
26 Jul 2022 03:06 AM
Hi @kwanchai,
Dynatrace would only be able to correlate XHR actions with the distributed tracing if the web or app server is monitored by OneAgents. In other words, distributed tracing would be captured if you have OneAgent monitoring and capturing the code-level information. Here is a document that can share some more details:
Try to validate if the application requests are captured under services? That would share with you the details of some Distributed trace level information that is triggered by the application.
If they are missing, then Dynatrace would not be able to like the XHR actions with the services that are triggered by the JMeter load test. Here is the document which will share more details to link cross origin XHR actions with the traces:
Kind regards,
Abhi
- Mark as New
- Subscribe to RSS Feed
- Permalink
26 Jul 2022 03:17 AM
Hi Abhi,
You mean If i want to track traffic when i load test via JMeter It's support only OneAgent ?
In this case i used Agentless not OneAgent.
- Mark as New
- Subscribe to RSS Feed
- Permalink
26 Jul 2022 11:10 PM
JMeter doesn't execute Javascript client side, so it won't appear in RUM. RUM stands for Real User Monitoring, and JMeter tries to emulate real users... You will get the requests in Services though...
Featured Posts

